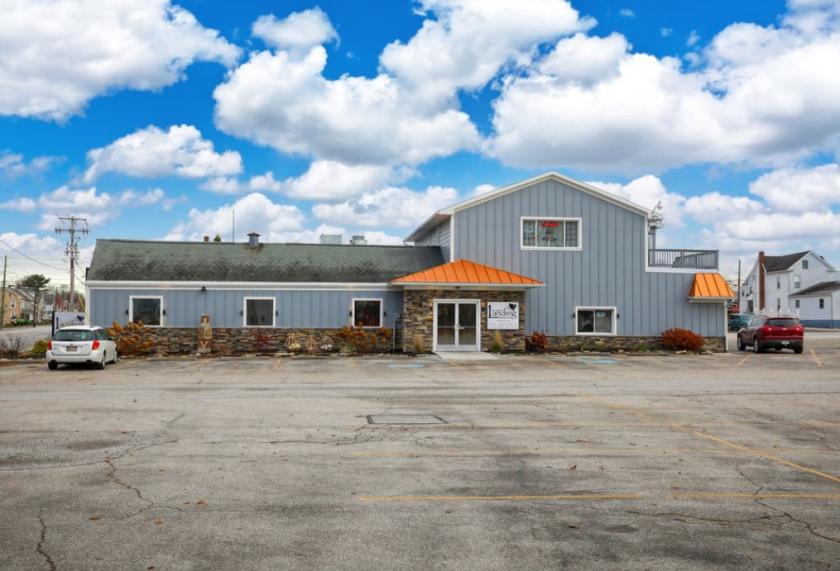
Retail Space
612 Frederick Street Hanover, PA 17331
612 Frederick Street Hanover, PA 17331
Details & Description
Property Highlights
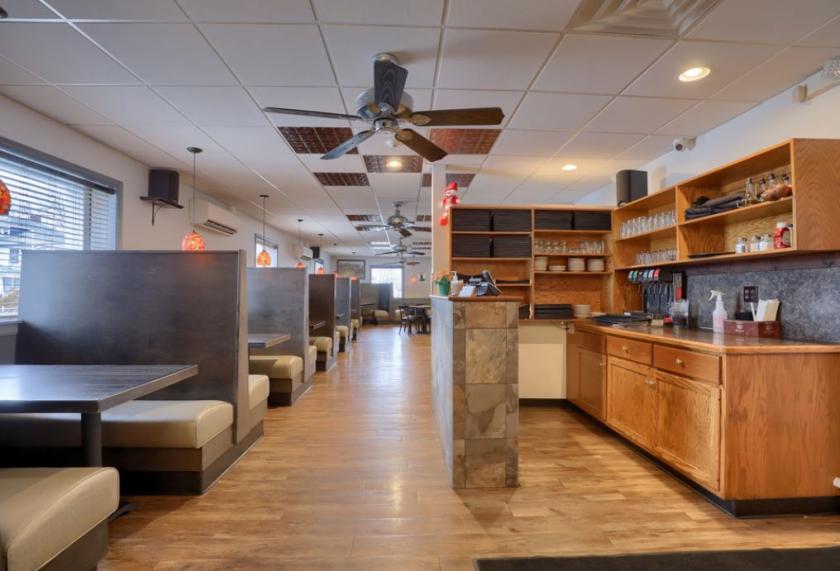
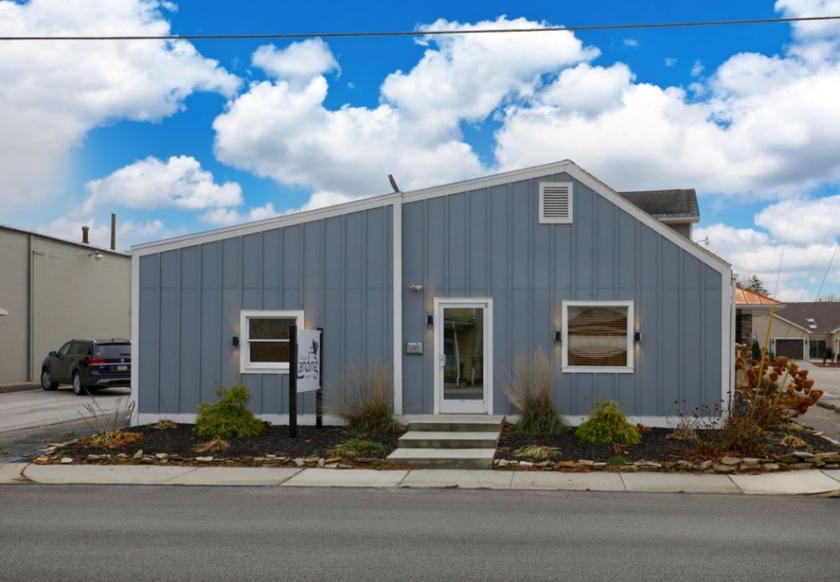
- • Complete exterior and interior remodel
- • state of the art kitchen equipment
- • 79 tables
- • gas fire place
- • dry stack stone work
Additional Photos

Listing Agents

Hedy Nelson
O: 410-972-4000
M: 410-292-0866
hedy@kwcommercial.com
O: 410-972-4000
M: 410-292-0866
hedy@kwcommercial.com
While we strive to provide the most accurate information, all listing information, and demographic data, is provided by third-parties. As such, MyEListing will not be responsible for the accuracy of the information. It is strongly recommended that you verify all information with the listing agent, and any relevant agencies, prior to making any decisions.


