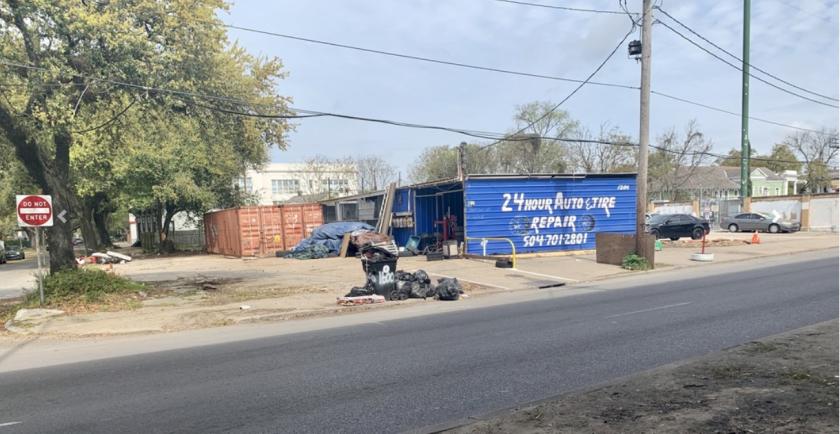
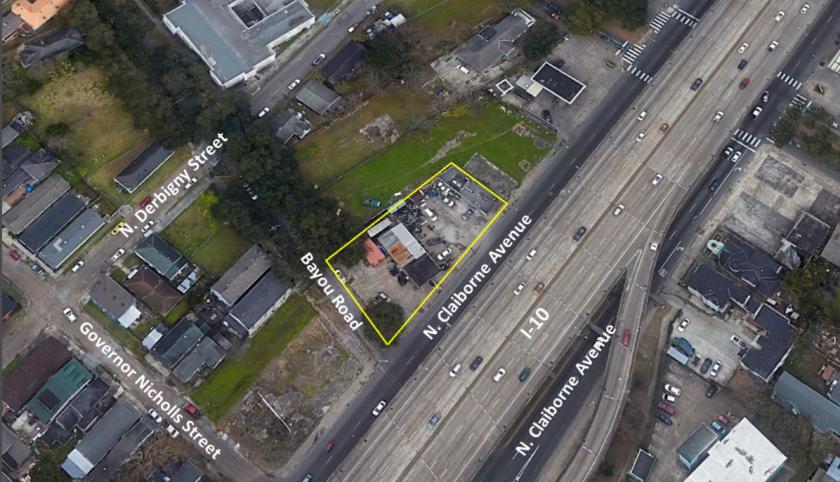
1-Mile | 3-Miles | 5-Miles | ||
---|---|---|---|---|
Total Population | 24,977 | 171,859 | 376,716 | |
Population Median Age | 42 | 40 | 39 | |
Population by Age | 0-9 Yrs | 2093 (8%) | 17728 (10%) | 41266 (10%) |
10-19 Yrs | 2017 (8%) | 15646 (9%) | 36938 (9%) | |
20-29 Yrs | 3310 (13%) | 26766 (15%) | 57935 (15%) | |
30-39 Yrs | 4758 (19%) | 31077 (18%) | 63769 (16%) | |
40-49 Yrs | 3203 (12%) | 21096 (12%) | 45492 (12%) | |
50-59 Yrs | 3405 (13%) | 22258 (12%) | 49427 (13%) | |
60-69 Yrs | 3313 (13%) | 21722 (12%) | 45794 (12%) | |
70+ Yrs | 2878 (11%) | 15565 (9%) | 36095 (9%) | |
Median HH Income | $33,526 | $37,867 | $45,573 | |
Total Household Income | < 24K | 5045 (40%) | 27287 (37%) | 48285 (31%) |
25-49K | 3068 (24%) | 16890 (22%) | 34108 (22%) | |
50-74K | 1476 (11%) | 9981 (13%) | 22799 (14%) | |
75-99K | 941 (7%) | 6080 (8%) | 14773 (9%) | |
100-199K | 1295 (10%) | 9733 (13%) | 23703 (15%) | |
200K+ | 627 (5%) | 3660 (4%) | 11242 (7%) | |
Highest Education Level | No Diploma | 3401 | 20205 | 36369 |
Diploma or GED | 4142 | 28686 | 60758 | |
Some College | 3826 | 26544 | 54823 | |
Assoc. Degree | 900 | 5908 | 12633 | |
Bachelors Degree | 4925 | 27866 | 62391 | |
Higher Degree | 2622 | 19365 | 47465 | |
Total Housing Units | 19,189 | 98,274 | 193,826 | |
--Owner-Occupied | 4,435 | 29,867 | 74,831 | |
--Renter-Occupied | 8,016 | 43,765 | 80,080 | |
Owner-Occupied Values | < 100K | 454 | 3263 | 7517 |
100-199K | 776 | 7969 | 19650 | |
200-299K | 984 | 6573 | 15323 | |
300-399K | 713 | 4831 | 10538 | |
400-499K | 474 | 2929 | 6768 | |
500K+ | 1034 | 4302 | 15035 | |
Total Working Age Population | 21,668 | 144,908 | 314,103 | |
In Work Force | 13,371 | 89,108 | 197,091 | |
Not In Work Force | 8,296 | 55,800 | 117,012 | |
Workforce Employed | 12,037 | 81,074 | 182,106 | |
Workforce Unemployed | 1,321 | 7,628 | 14,263 | |
Civlian Workforce | 13,358 | 88,701 | 196,369 | |
Military Workforce | 13 | 407 | 722 | |
Total Households | 12,451 | 73,632 | 154,911 | |
Family Households | 4,070 | 29,262 | 71,683 | |
Non-Family Households | 8,381 | 44,369 | 83,228 | |
Married Couple | 2,081 | 15,609 | 44,052 | |
Other Family | 1,989 | 13,653 | 27,630 | |
Married w/Child | 423 | 4,385 | 14,870 | |
Single Male w/Child | 135 | 981 | 2,350 | |
Single Female w/Child | 875 | 5,463 | 10,703 |
Population Change Last Two Decades - Plus Projection
2000 | % | 2010 | % | 2020 | % | 2030 | |
---|---|---|---|---|---|---|---|
Louisiana | 4,468,976 | +1 | 4,533,372 | +1 | 4,588,310 | +5 | 4,813,420 |
Jefferson Parish | 455,466 | -5 | 432,552 | +4 | 450,200 | +1 | 454,670 |
Lafourche Parish | 89,974 | +7 | 96,318 | 0 | 95,990 | 0 | 95,990 |
Orleans Parish | 484,674 | -29 | 343,829 | -26 | 255,440 | 0 | 256,010 |
Plaquemines Parish | 26,757 | -14 | 23,042 | +12 | 25,770 | +13 | 29,130 |
St. Bernard Parish | 67,229 | -47 | 35,897 | -38 | 22,210 | +1 | 22,480 |
Total Working Age Population:
Total Households:
Total Working Age Population:
Total Households:
Total Working Age Population:
Total Households: