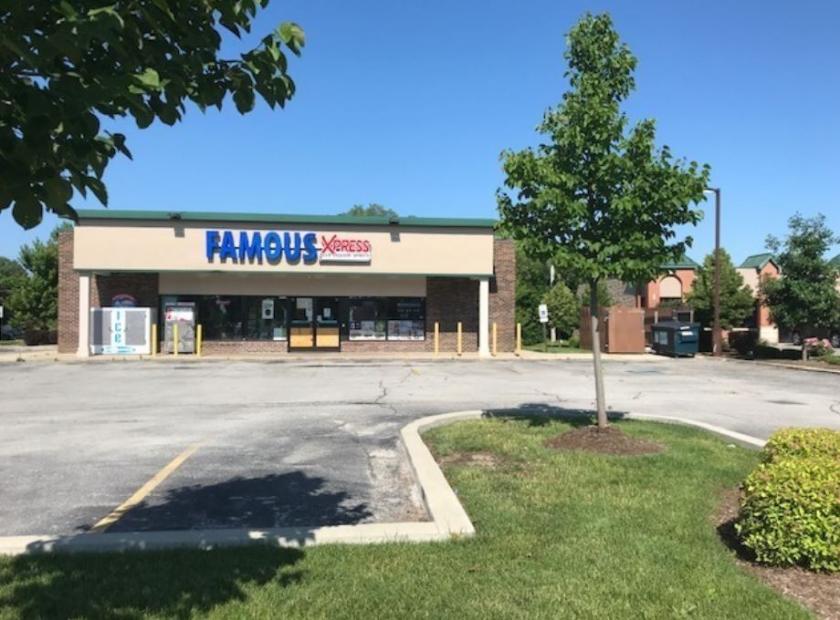
Retail Space
16658 Oak Park Avenue Tinley Park, IL 60477
16658 Oak Park Avenue Tinley Park, IL 60477
Details & Description
Property Highlights
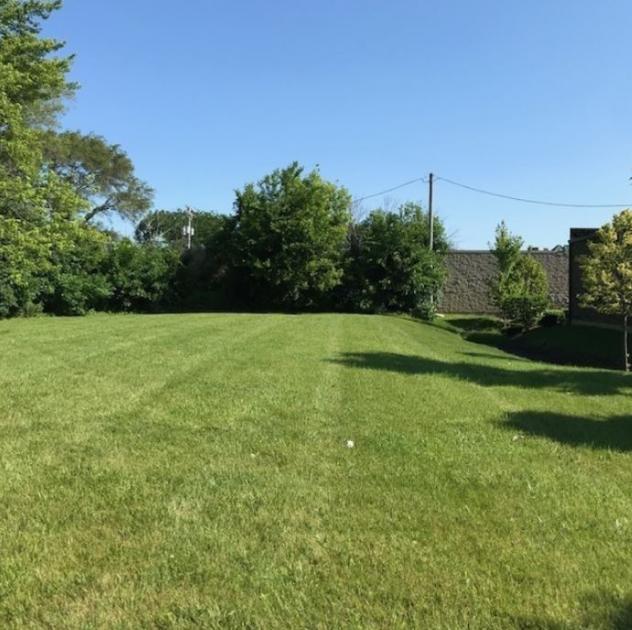
- • 2800 square feet commercial building on 1 acre.
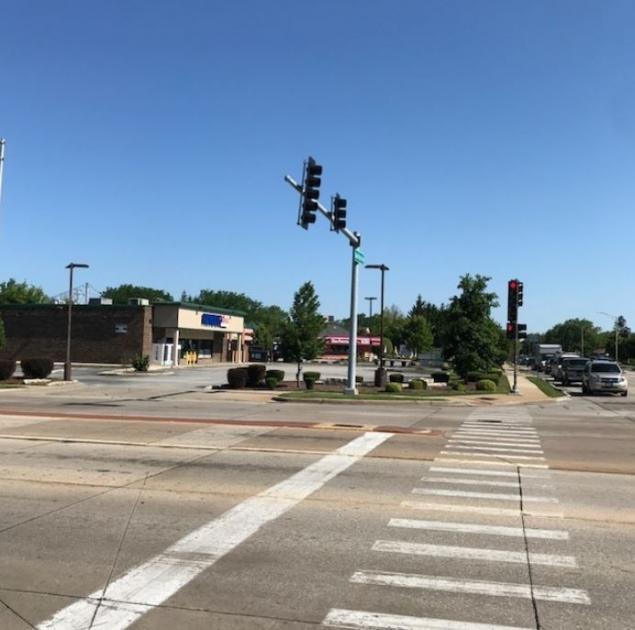
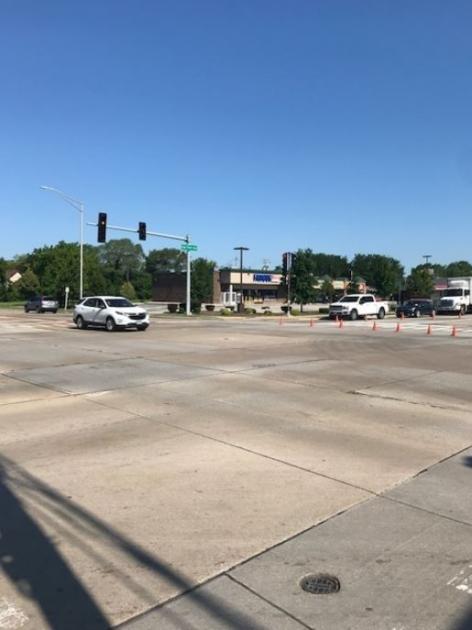
- • Heavy traffic count from two main streets.
- • Paved Parking Area.
- • Building space is more wide than deep.
Additional Photos
Listing Agents

William Mustafa
KW Commercial
O: 312-471-6444
M: 708-261-1150
wmustafa@kwcommercial.com
KW Commercial
O: 312-471-6444
M: 708-261-1150
wmustafa@kwcommercial.com
While we strive to provide the most accurate information, all listing information, and demographic data, is provided by third-parties. As such, MyEListing will not be responsible for the accuracy of the information. It is strongly recommended that you verify all information with the listing agent, and any relevant agencies, prior to making any decisions.


