Specialty Real Estate
214 East Hallandale Beach Boulevard Hallandale Beach, FL 33009
214 East Hallandale Beach Boulevard Hallandale Beach, FL 33009
Details & Description
Property Highlights
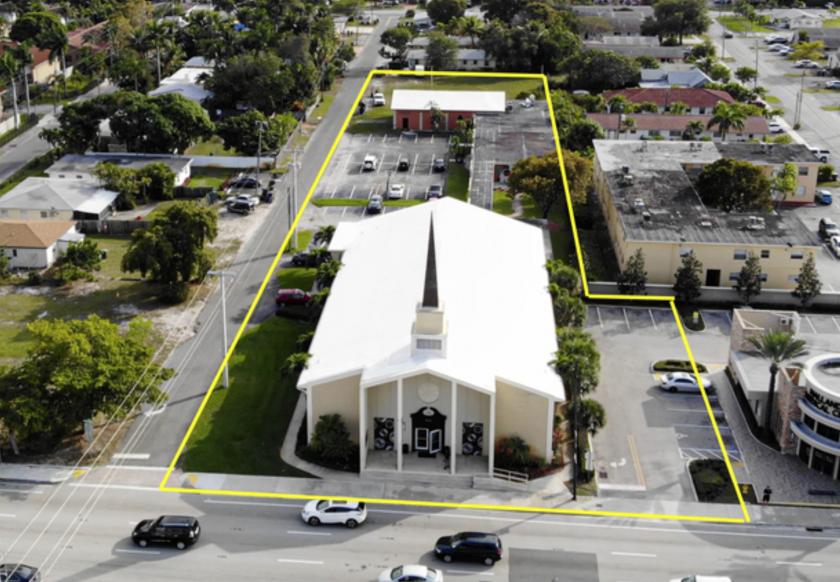
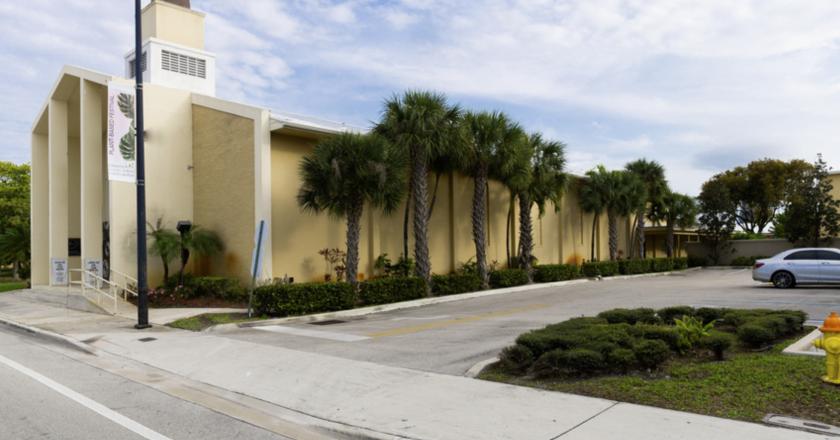
• The Property is within walking distance of Hallandale Beachs hottest corner Hallandale Beach Blvd US 1.
• IN-PLACE CASH FLOW The current owner prefers to lease back for 12-24 months after the closing.
Listing Agents

Gus Martinez PA
The Martinez Team
O: 954-394-7078
M: 954-394-7078
gusmartinez@kw.com
The Martinez Team
O: 954-394-7078
M: 954-394-7078
gusmartinez@kw.com
While we strive to provide the most accurate information, all listing information, and demographic data, is provided by third-parties. As such, MyEListing will not be responsible for the accuracy of the information. It is strongly recommended that you verify all information with the listing agent, and any relevant agencies, prior to making any decisions.