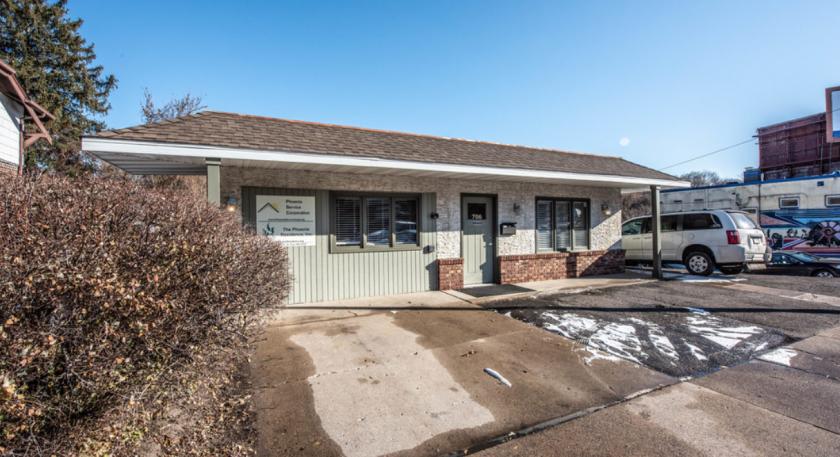
1-Mile | 3-Miles | 5-Miles | ||
---|---|---|---|---|
Total Population | 16,267 | 112,206 | 336,337 | |
Population Median Age | 33 | 37 | 35 | |
Population by Age | 0-9 Yrs | 2658 (16%) | 15062 (13%) | 48469 (14%) |
10-19 Yrs | 2390 (14%) | 13347 (11%) | 44807 (13%) | |
20-29 Yrs | 2777 (17%) | 18849 (16%) | 56326 (16%) | |
30-39 Yrs | 2420 (14%) | 17731 (15%) | 53371 (15%) | |
40-49 Yrs | 1804 (11%) | 12511 (11%) | 37476 (11%) | |
50-59 Yrs | 1908 (11%) | 13363 (11%) | 39408 (11%) | |
60-69 Yrs | 1420 (8%) | 11477 (10%) | 31733 (9%) | |
70+ Yrs | 890 (5%) | 9865 (8%) | 24748 (7%) | |
Median HH Income | $56,197 | $56,515 | $58,610 | |
Total Household Income | < 24K | 1267 (20%) | 10528 (22%) | 25637 (20%) |
25-49K | 1435 (23%) | 10306 (22%) | 28872 (22%) | |
50-74K | 1187 (19%) | 8653 (18%) | 23693 (18%) | |
75-99K | 795 (12%) | 5571 (11%) | 16780 (13%) | |
100-199K | 1192 (19%) | 8830 (18%) | 24850 (19%) | |
200K+ | 245 (4%) | 2592 (5%) | 7287 (5%) | |
Highest Education Level | No Diploma | 1268 | 8812 | 28471 |
Diploma or GED | 2711 | 16963 | 48709 | |
Some College | 2196 | 15349 | 42037 | |
Assoc. Degree | 899 | 6016 | 18375 | |
Bachelors Degree | 2028 | 18437 | 50119 | |
Higher Degree | 963 | 10727 | 30596 | |
Total Housing Units | 6,532 | 49,829 | 135,067 | |
--Owner-Occupied | 3,665 | 22,210 | 67,205 | |
--Renter-Occupied | 2,455 | 24,270 | 59,914 | |
Owner-Occupied Values | < 100K | 196 | 1645 | 4920 |
100-199K | 2151 | 9394 | 27575 | |
200-299K | 1078 | 6242 | 18662 | |
300-399K | 133 | 2206 | 7425 | |
400-499K | 45 | 1093 | 3927 | |
500K+ | 62 | 1630 | 4695 | |
Total Working Age Population | 12,163 | 88,961 | 260,397 | |
In Work Force | 9,154 | 61,199 | 181,287 | |
Not In Work Force | 3,009 | 27,763 | 79,110 | |
Workforce Employed | 8,518 | 57,728 | 172,027 | |
Workforce Unemployed | 636 | 3,453 | 9,142 | |
Civlian Workforce | 9,154 | 61,181 | 181,168 | |
Military Workforce | 0 | 17 | 119 | |
Total Households | 6,120 | 46,480 | 127,118 | |
Family Households | 3,741 | 23,513 | 72,520 | |
Non-Family Households | 2,379 | 22,967 | 54,599 | |
Married Couple | 2,144 | 15,312 | 47,735 | |
Other Family | 1,597 | 8,200 | 24,785 | |
Married w/Child | 1,038 | 6,169 | 21,418 | |
Single Male w/Child | 311 | 1,200 | 3,557 | |
Single Female w/Child | 803 | 4,032 | 11,328 |
Population Change Last Two Decades - Plus Projection
2000 | % | 2010 | % | 2020 | % | 2030 | |
---|---|---|---|---|---|---|---|
Minnesota | 4,919,479 | +8 | 5,303,925 | +7 | 5,687,161 | +5 | 5,974,304 |
Dakota County | 355,904 | +12 | 398,552 | +9 | 434,203 | +7 | 463,564 |
Hennepin County | 1,116,200 | +3 | 1,152,425 | +12 | 1,294,371 | +9 | 1,407,332 |
Ramsey County | 511,035 | 0 | 508,640 | +12 | 567,959 | +9 | 616,408 |
Washington County | 201,130 | +18 | 238,136 | +11 | 264,517 | +8 | 285,490 |
Total Working Age Population:
Total Households:
Total Working Age Population:
Total Households:
Total Working Age Population:
Total Households: