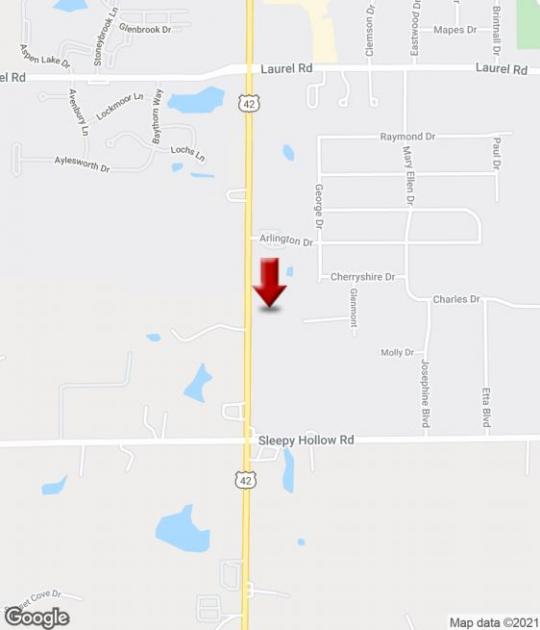
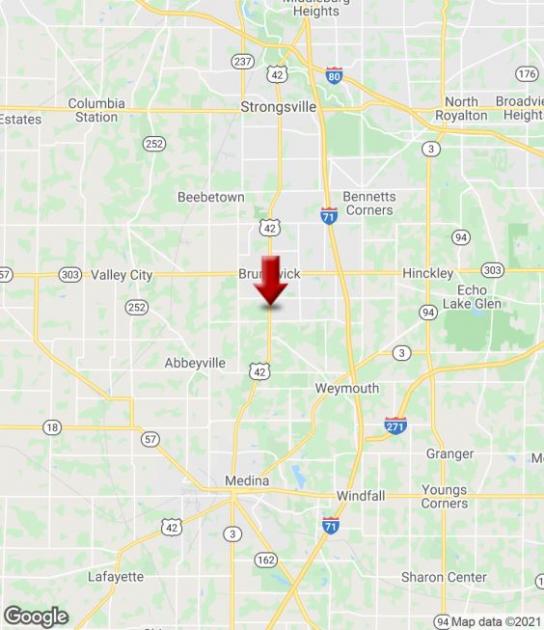
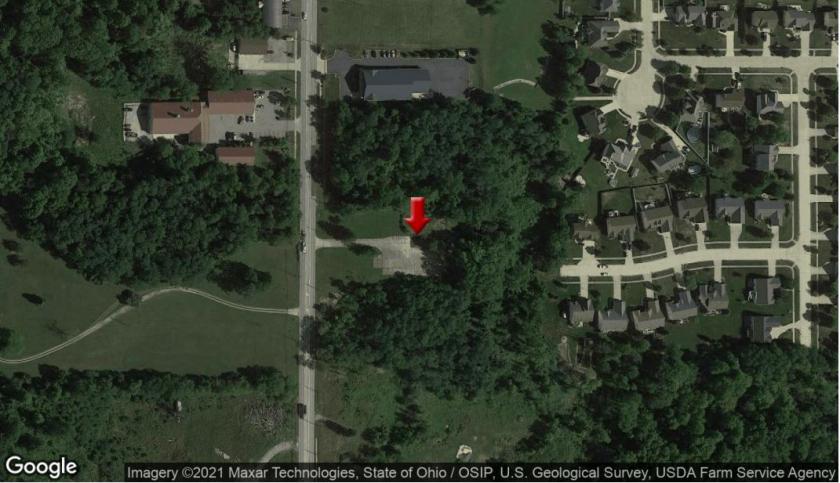
1-Mile | 3-Miles | 5-Miles | ||
---|---|---|---|---|
Total Population | 3,948 | 34,688 | 74,834 | |
Population Median Age | 40 | 40 | 41 | |
Population by Age | 0-9 Yrs | 422 (10%) | 3862 (11%) | 8107 (10%) |
10-19 Yrs | 503 (12%) | 4617 (13%) | 9720 (12%) | |
20-29 Yrs | 540 (13%) | 4113 (11%) | 7933 (10%) | |
30-39 Yrs | 387 (9%) | 4459 (12%) | 8927 (11%) | |
40-49 Yrs | 565 (14%) | 4638 (13%) | 10157 (13%) | |
50-59 Yrs | 594 (15%) | 5248 (15%) | 11505 (15%) | |
60-69 Yrs | 533 (13%) | 4095 (11%) | 9590 (12%) | |
70+ Yrs | 404 (10%) | 3656 (10%) | 8895 (11%) | |
Median HH Income | $60,336 | $71,917 | $78,493 | |
Total Household Income | < 24K | 292 (17%) | 1587 (11%) | 3382 (11%) |
25-49K | 393 (23%) | 2684 (19%) | 5242 (17%) | |
50-74K | 312 (19%) | 2852 (21%) | 5453 (18%) | |
75-99K | 249 (15%) | 2000 (14%) | 4084 (13%) | |
100-199K | 355 (21%) | 3679 (27%) | 8969 (30%) | |
200K+ | 40 (2%) | 771 (5%) | 2167 (7%) | |
Highest Education Level | No Diploma | 262 | 1461 | 2576 |
Diploma or GED | 925 | 7507 | 15244 | |
Some College | 736 | 5909 | 11993 | |
Assoc. Degree | 339 | 2530 | 4940 | |
Bachelors Degree | 375 | 4585 | 11989 | |
Higher Degree | 157 | 2031 | 5962 | |
Total Housing Units | 1,690 | 14,263 | 30,486 | |
--Owner-Occupied | 1,078 | 10,363 | 23,653 | |
--Renter-Occupied | 563 | 3,212 | 5,644 | |
Owner-Occupied Values | < 100K | 114 | 724 | 1293 |
100-199K | 630 | 5708 | 11061 | |
200-299K | 277 | 3006 | 7148 | |
300-399K | 36 | 591 | 2570 | |
400-499K | 12 | 162 | 916 | |
500K+ | 8 | 171 | 666 | |
Total Working Age Population | 3,221 | 28,002 | 60,768 | |
In Work Force | 2,153 | 19,524 | 41,340 | |
Not In Work Force | 1,068 | 8,479 | 19,428 | |
Workforce Employed | 2,089 | 18,992 | 40,191 | |
Workforce Unemployed | 64 | 520 | 1,136 | |
Civlian Workforce | 2,153 | 19,512 | 41,328 | |
Military Workforce | 0 | 12 | 12 | |
Total Households | 1,640 | 13,574 | 29,297 | |
Family Households | 1,057 | 9,172 | 20,708 | |
Non-Family Households | 583 | 4,402 | 8,589 | |
Married Couple | 723 | 7,398 | 17,127 | |
Other Family | 334 | 1,774 | 3,581 | |
Married w/Child | 216 | 2,854 | 6,430 | |
Single Male w/Child | 40 | 194 | 584 | |
Single Female w/Child | 152 | 666 | 1,115 |
Population Change Last Two Decades - Plus Projection
2000 | % | 2010 | % | 2020 | % | 2030 | |
---|---|---|---|---|---|---|---|
Ohio | 11,353,140 | +2 | 11,536,504 | 0 | 11,574,870 | 0 | 11,615,100 |
Cuyahoga County | 1,393,978 | -8 | 1,280,122 | -6 | 1,209,550 | -5 | 1,154,210 |
Lorain County | 284,664 | +6 | 301,356 | +3 | 310,230 | +3 | 320,430 |
Medina County | 151,095 | +14 | 172,332 | +7 | 184,670 | +5 | 194,510 |
Total Working Age Population:
Total Households:
Total Working Age Population:
Total Households:
Total Working Age Population:
Total Households: