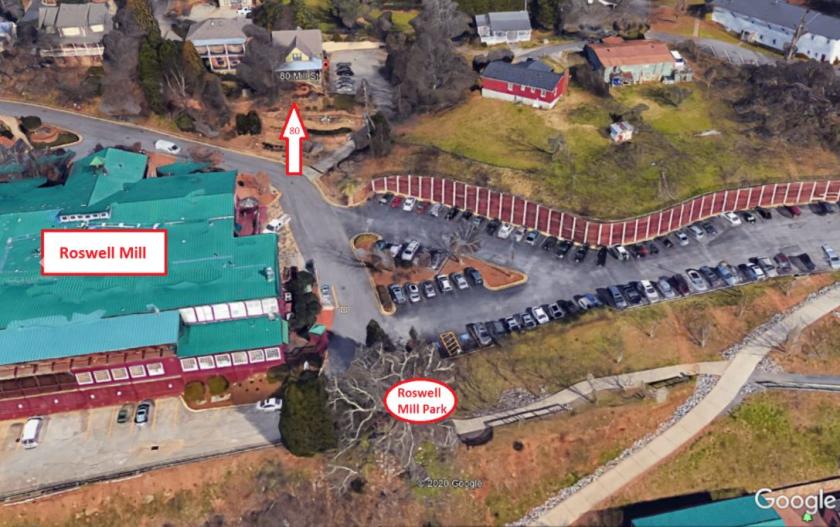
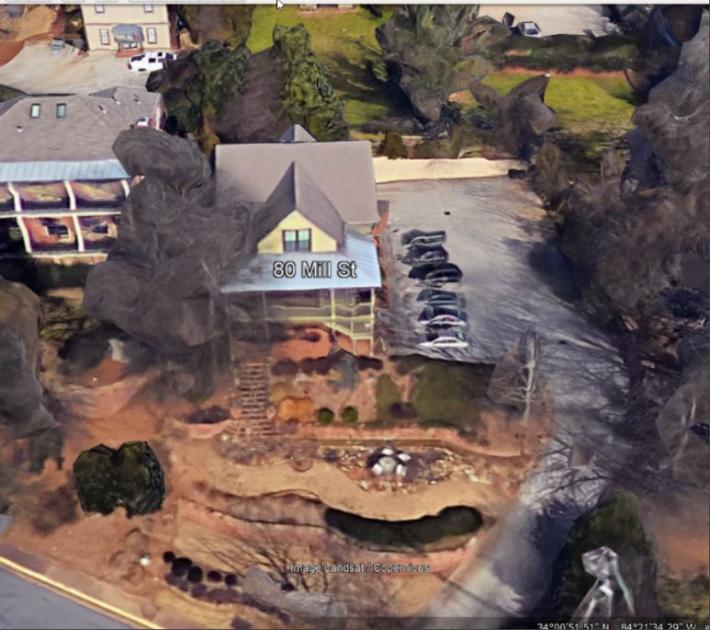
1-Mile | 3-Miles | 5-Miles | ||
---|---|---|---|---|
Total Population | 6,551 | 78,274 | 204,594 | |
Population Median Age | 37 | 37 | 38 | |
Population by Age | 0-9 Yrs | 1070 (16%) | 10034 (12%) | 25951 (12%) |
10-19 Yrs | 743 (11%) | 10184 (13%) | 27891 (13%) | |
20-29 Yrs | 614 (9%) | 10550 (13%) | 22641 (11%) | |
30-39 Yrs | 1101 (16%) | 12613 (16%) | 30363 (14%) | |
40-49 Yrs | 1074 (16%) | 11232 (14%) | 29426 (14%) | |
50-59 Yrs | 726 (11%) | 10025 (12%) | 29110 (14%) | |
60-69 Yrs | 751 (11%) | 7381 (9%) | 21840 (10%) | |
70+ Yrs | 471 (7%) | 6254 (7%) | 17372 (8%) | |
Median HH Income | $77,480 | $78,458 | $95,030 | |
Total Household Income | < 24K | 280 (11%) | 3379 (11%) | 6845 (8%) |
25-49K | 356 (14%) | 5698 (18%) | 12593 (16%) | |
50-74K | 603 (23%) | 5592 (18%) | 12526 (15%) | |
75-99K | 287 (11%) | 3541 (11%) | 9018 (11%) | |
100-199K | 682 (26%) | 7761 (25%) | 22578 (28%) | |
200K+ | 327 (12%) | 4346 (14%) | 14820 (18%) | |
Highest Education Level | No Diploma | 321 | 4096 | 6620 |
Diploma or GED | 818 | 8453 | 17459 | |
Some College | 695 | 7848 | 20640 | |
Assoc. Degree | 285 | 3521 | 8884 | |
Bachelors Degree | 1706 | 19277 | 54878 | |
Higher Degree | 717 | 10327 | 32122 | |
Total Housing Units | 2,737 | 33,025 | 83,446 | |
--Owner-Occupied | 1,701 | 16,536 | 50,481 | |
--Renter-Occupied | 834 | 13,780 | 27,898 | |
Owner-Occupied Values | < 100K | 163 | 1018 | 1708 |
100-199K | 227 | 2470 | 5458 | |
200-299K | 236 | 2859 | 7448 | |
300-399K | 548 | 3693 | 11419 | |
400-499K | 233 | 2441 | 9875 | |
500K+ | 294 | 4056 | 14573 | |
Total Working Age Population | 5,051 | 62,158 | 161,198 | |
In Work Force | 3,578 | 45,399 | 115,342 | |
Not In Work Force | 1,473 | 16,758 | 45,856 | |
Workforce Employed | 3,331 | 43,515 | 110,907 | |
Workforce Unemployed | 235 | 1,771 | 4,252 | |
Civlian Workforce | 3,566 | 45,287 | 115,158 | |
Military Workforce | 12 | 113 | 184 | |
Total Households | 2,535 | 30,316 | 78,380 | |
Family Households | 1,557 | 18,725 | 51,852 | |
Non-Family Households | 978 | 11,591 | 26,528 | |
Married Couple | 1,148 | 14,230 | 41,836 | |
Other Family | 409 | 4,495 | 10,016 | |
Married w/Child | 484 | 6,161 | 19,124 | |
Single Male w/Child | 36 | 707 | 1,522 | |
Single Female w/Child | 145 | 1,570 | 4,046 |
Population Change Last Two Decades - Plus Projection
2000 | % | 2010 | % | 2020 | % | 2030 | |
---|---|---|---|---|---|---|---|
Georgia | 8,186,453 | +18 | 9,687,653 | +12 | 10,833,472 | +13 | 12,292,423 |
Cherokee County | 141,903 | +51 | 214,346 | +24 | 266,617 | +20 | 320,849 |
Cobb County | 607,751 | +13 | 688,078 | +15 | 790,588 | +19 | 938,747 |
DeKalb County | 665,865 | +4 | 691,893 | +15 | 793,154 | +19 | 944,045 |
Fulton County | 816,006 | +13 | 920,581 | +19 | 1,099,181 | +18 | 1,300,861 |
Gwinnett County | 588,448 | +37 | 805,321 | +21 | 971,145 | +21 | 1,175,358 |
Total Working Age Population:
Total Households:
Total Working Age Population:
Total Households:
Total Working Age Population:
Total Households: