Large conference roomtraining room area
Private officess 24 hr access
Extra storage
two separate private entrances front and rear.
Lots of extra parking including extra rear parking lot with private suite access front and rear
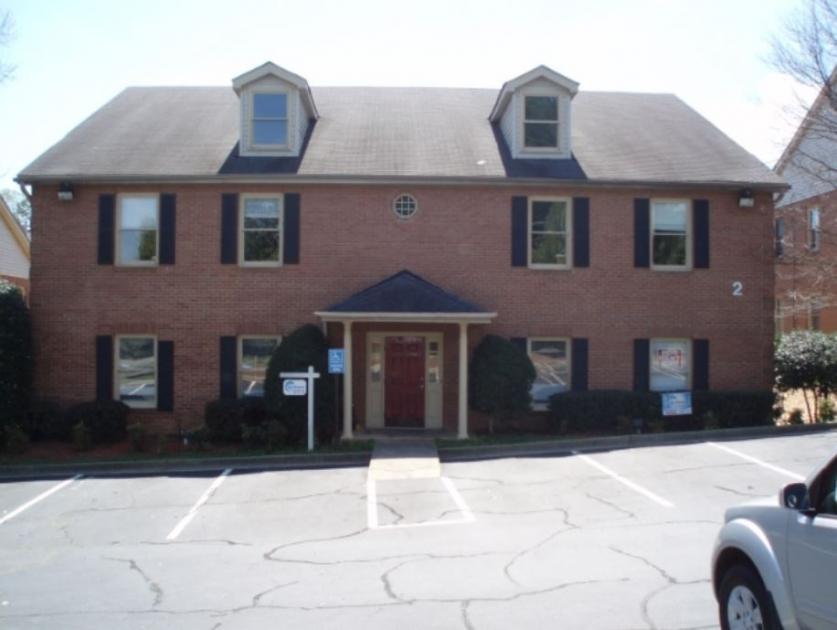
PRIME PRIVATE OFFICE SUITE-MAIN FLOOR/FRONT DOOR-1350 Square feet
FRONT AND REAR PRIVATE SUITE ENTRANCES!!
*UTILITIES ARE A FLAT PRO-RATED PAYMENT MONTHLY ONLY $175 P MONTH
*UTILITIES FEES DO NOT INCLUDE INTERNET OR TELEPHONE-YOU HANDLE THESE YOURSELF
NO CAM FEES , ASSOCIATION FEES, OR PASS THRU EXPENSES
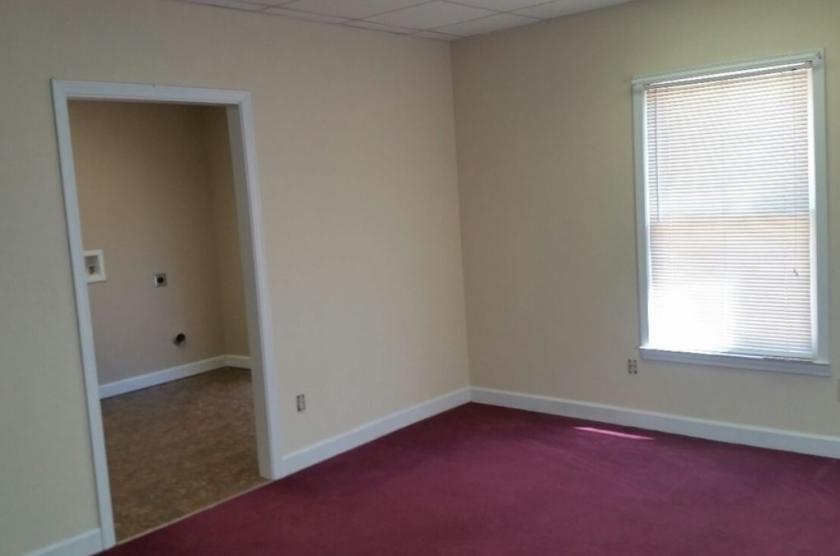
NEW FLOORS
GREAT OFFICE SUITE FOR CHIROPRACTIC OFFICE PRACTICE, iNSURANCE AGENCY, REAL ESTATE OFFICES, PHYSICAL THERAPIST, PSYCHOLOGIST, ATTORNEYS OFFICE, MEDICAL, DENTAL, MASSAGE THERAPY, GENERAL OFFICE
*Private Restroom
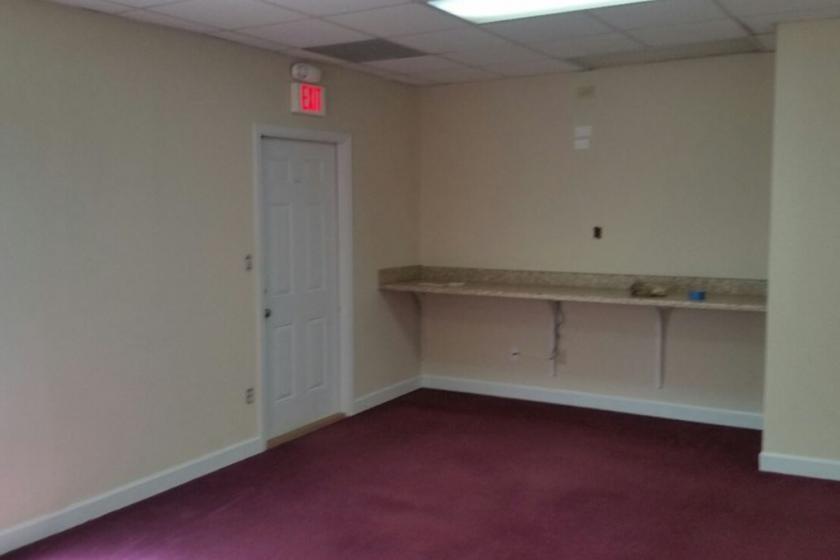
*Plumbing to central area for Breakroom, Cleaning room, Washer/Dryer, Large sink area
*(2) 220 Electrical outlet connections
*Front and rear private entrance
*Large oversized open Conference room/Training/Therapy room area
*Extra storage
*Lobby
*Private office(s)s *24 hr access
*Lots of extra parking including extra rear parking lot with private suite access front and rear
Owner/Agent
No part of this information may be copied, reproduced, repurposed, or screen-captured for any commercial purpose without prior written authorization from MyEListing.
While we strive to provide the most accurate information, all listing information, and demographic data, is provided by third-parties. As such, MyEListing will not be responsible for the accuracy of the information. It is strongly recommended that you verify all information with the listing agent, and any relevant agencies, prior to making any decisions.
What is the asking price for 2440 Sandy Plains Road in Marietta?
The asking price for 2440 Sandy Plains Road is $13.30 a SF per Year
What is the building size of this commercial Office property?
The size of this lease property at '.2440 Sandy Plains Road.' is 1350 square feet
What kind of Office is the propery at 2440 Sandy Plains Road?
The property at 2440 Sandy Plains Road Marietta, GA 30066 is listed as a Professional Office property
What is the population within 1 mile of 2440 Sandy Plains Road in Marietta?
The population within 1 mile of 2440 Sandy Plains Road Marietta, GA 30066 is 8,007 people.
Who do I contact for questions about 2440 Sandy Plains Road?
You should contact the listing agent,
Scott Morchower , for any details regarding this commercial listing.