Commercial Land
Powder Springs Rd SW Marietta, GA 30064
Powder Springs Rd SW Marietta, GA 30064
Details & Description
Property Highlights
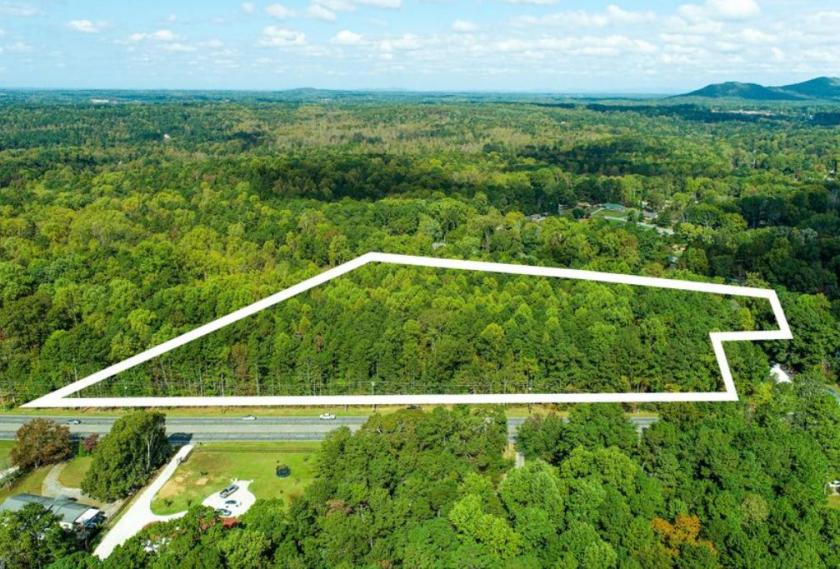
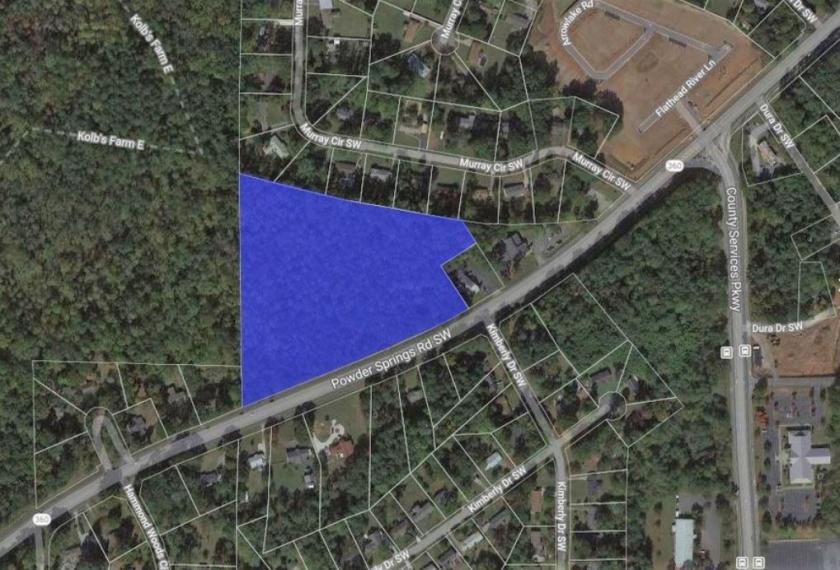
- • 10.8 acres
- • Sewer Available
- • Zoned for Senior Living
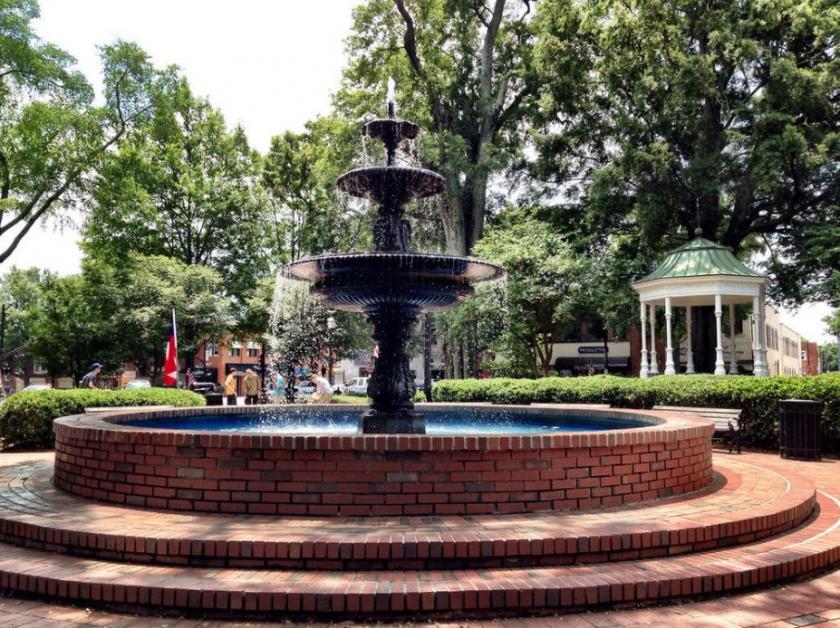
- • Close to Marietta Square and City Club Golf Course
Additional Photos

Listing Agents

Tony Morris
KW Commercial
O: 678-631-1700
M: 404-218-8267
info@themeridianway.com
KW Commercial
O: 678-631-1700
M: 404-218-8267
info@themeridianway.com
While we strive to provide the most accurate information, all listing information, and demographic data, is provided by third-parties. As such, MyEListing will not be responsible for the accuracy of the information. It is strongly recommended that you verify all information with the listing agent, and any relevant agencies, prior to making any decisions.


