Commercial Land
22608 State Highway 71 Spicewood, TX 78669
22608 State Highway 71 Spicewood, TX 78669
Details & Description
Property Highlights
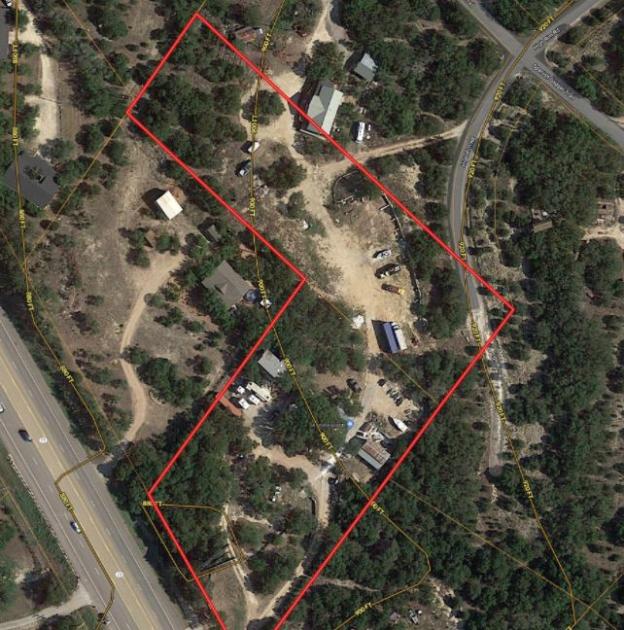
- • Approx. 255 of SH 71 frontage
- • In rapidly growing Spicewood area
- • Close to 2000 acre planned Thomas Ranch
- • 11382 Traffic counts Pace Bend Rd, 2018
- • Travis County, not in an ETJ or in city limits
Listing Agents

Heather Morrison
O: 512-940-0565
heather.morrison@kw.com
O: 512-940-0565
heather.morrison@kw.com
While we strive to provide the most accurate information, all listing information, and demographic data, is provided by third-parties. As such, MyEListing will not be responsible for the accuracy of the information. It is strongly recommended that you verify all information with the listing agent, and any relevant agencies, prior to making any decisions.


