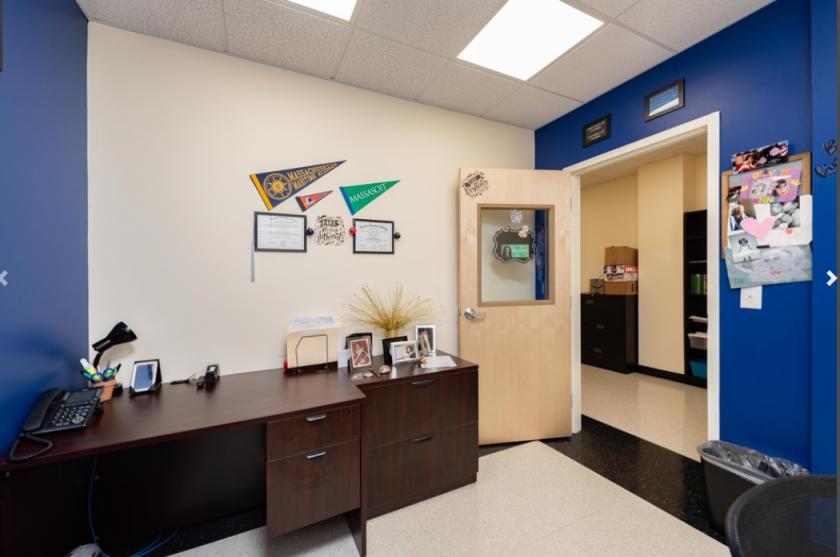
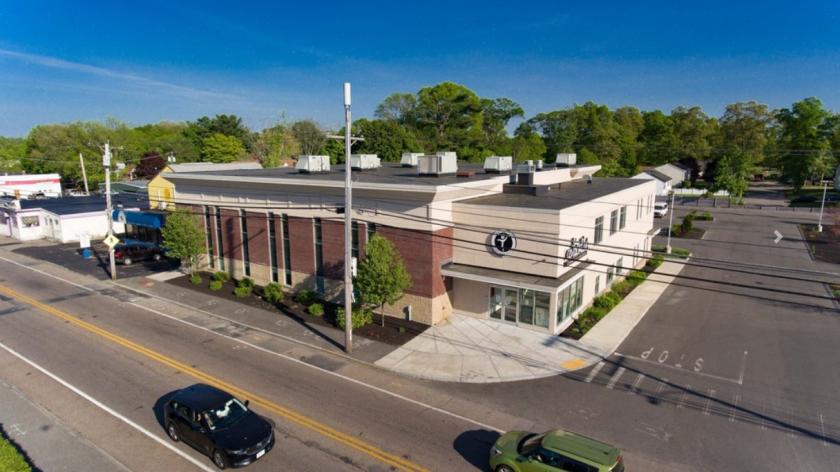
1-Mile | 3-Miles | 5-Miles | ||
---|---|---|---|---|
Total Population | 11,199 | 102,721 | 173,977 | |
Population Median Age | 38 | 37 | 38 | |
Population by Age | 0-9 Yrs | 1254 (11%) | 13517 (13%) | 21212 (12%) |
10-19 Yrs | 1557 (13%) | 14682 (14%) | 23958 (13%) | |
20-29 Yrs | 1708 (15%) | 14677 (14%) | 23507 (13%) | |
30-39 Yrs | 1587 (14%) | 14662 (14%) | 23607 (13%) | |
40-49 Yrs | 1231 (10%) | 12336 (12%) | 21995 (12%) | |
50-59 Yrs | 1388 (12%) | 13849 (13%) | 23984 (13%) | |
60-69 Yrs | 1460 (13%) | 10489 (10%) | 19287 (11%) | |
70+ Yrs | 1012 (9%) | 8510 (8%) | 16428 (9%) | |
Median HH Income | $64,150 | $65,707 | $72,669 | |
Total Household Income | < 24K | 826 (22%) | 7302 (21%) | 10641 (17%) |
25-49K | 582 (15%) | 6455 (18%) | 10813 (17%) | |
50-74K | 753 (20%) | 5326 (15%) | 9445 (15%) | |
75-99K | 594 (15%) | 4640 (13%) | 7581 (12%) | |
100-199K | 838 (22%) | 9081 (26%) | 17822 (29%) | |
200K+ | 155 (4%) | 1637 (4%) | 3797 (6%) | |
Highest Education Level | No Diploma | 987 | 11743 | 15548 |
Diploma or GED | 2814 | 22435 | 37661 | |
Some College | 1951 | 13709 | 24012 | |
Assoc. Degree | 565 | 5396 | 10205 | |
Bachelors Degree | 983 | 9902 | 20610 | |
Higher Degree | 427 | 3929 | 8988 | |
Total Housing Units | 3,879 | 36,602 | 63,493 | |
--Owner-Occupied | 2,542 | 20,344 | 38,824 | |
--Renter-Occupied | 1,205 | 14,097 | 21,275 | |
Owner-Occupied Values | < 100K | 21 | 531 | 1105 |
100-199K | 586 | 2890 | 4014 | |
200-299K | 1104 | 8615 | 13627 | |
300-399K | 671 | 5675 | 12783 | |
400-499K | 101 | 1603 | 4400 | |
500K+ | 58 | 1031 | 2894 | |
Total Working Age Population | 9,075 | 80,372 | 138,575 | |
In Work Force | 6,484 | 56,409 | 95,938 | |
Not In Work Force | 2,592 | 23,963 | 42,636 | |
Workforce Employed | 5,911 | 52,310 | 89,940 | |
Workforce Unemployed | 562 | 4,076 | 5,960 | |
Civlian Workforce | 6,473 | 56,385 | 95,900 | |
Military Workforce | 10 | 24 | 38 | |
Total Households | 3,748 | 34,441 | 60,099 | |
Family Households | 2,658 | 23,838 | 41,405 | |
Non-Family Households | 1,089 | 10,603 | 18,694 | |
Married Couple | 1,511 | 13,761 | 26,670 | |
Other Family | 1,148 | 10,076 | 14,735 | |
Married w/Child | 516 | 5,815 | 11,149 | |
Single Male w/Child | 191 | 1,272 | 1,732 | |
Single Female w/Child | 452 | 4,375 | 5,952 |
Population Change Last Two Decades - Plus Projection
2000 | % | 2010 | % | 2020 | % | 2030 | |
---|---|---|---|---|---|---|---|
Massachusetts | 6,349,097 | +3 | 6,547,629 | +6 | 6,933,887 | +4 | 7,225,472 |
Bristol County | 534,678 | +3 | 548,285 | +2 | 561,478 | +1 | 567,277 |
Norfolk County | 650,308 | +3 | 670,850 | +7 | 718,394 | +7 | 765,912 |
Plymouth County | 472,822 | +5 | 494,919 | +5 | 518,508 | +3 | 534,464 |
Total Working Age Population:
Total Households:
Total Working Age Population:
Total Households:
Total Working Age Population:
Total Households: