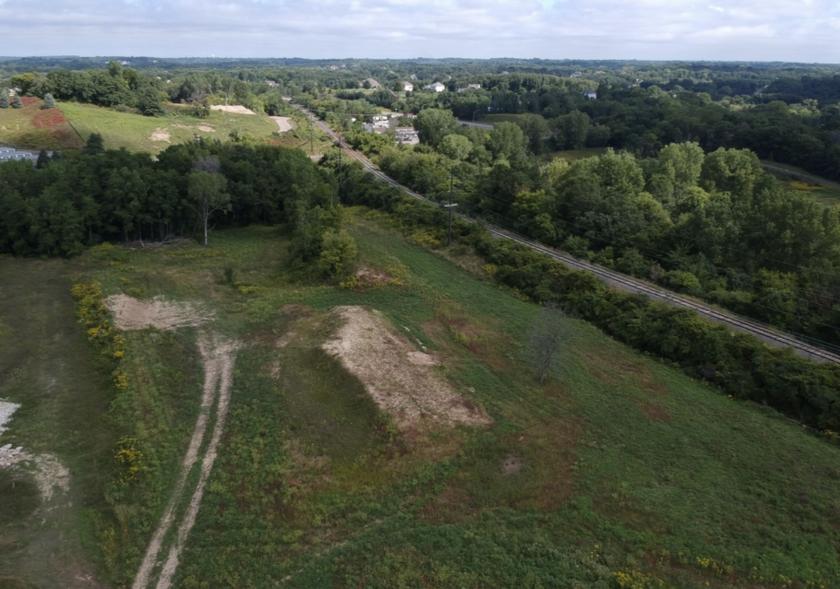
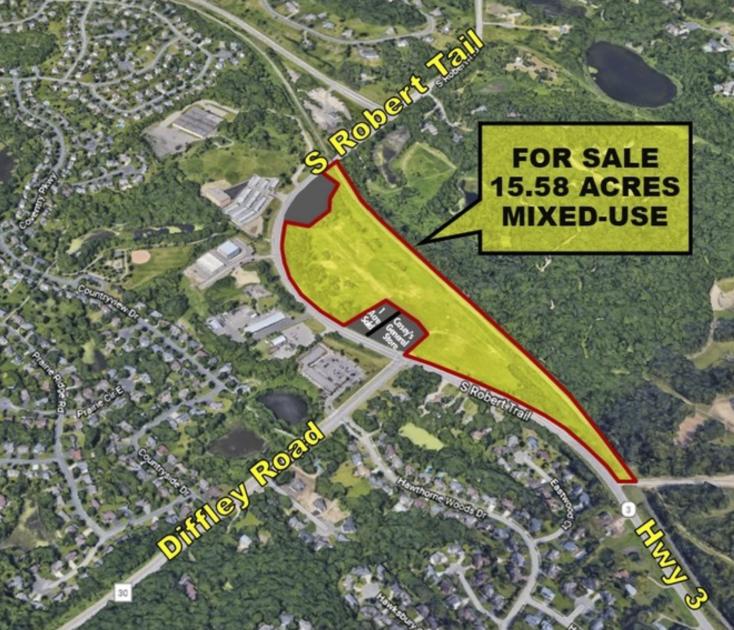
1-Mile | 3-Miles | 5-Miles | ||
---|---|---|---|---|
Total Population | 7,743 | 70,382 | 183,792 | |
Population Median Age | 40 | 39 | 39 | |
Population by Age | 0-9 Yrs | 784 (10%) | 8567 (12%) | 21655 (11%) |
10-19 Yrs | 702 (9%) | 8528 (12%) | 21741 (11%) | |
20-29 Yrs | 1488 (19%) | 9693 (13%) | 26864 (14%) | |
30-39 Yrs | 1159 (14%) | 10410 (14%) | 28202 (15%) | |
40-49 Yrs | 860 (11%) | 7554 (10%) | 21213 (11%) | |
50-59 Yrs | 1103 (14%) | 9838 (13%) | 24342 (13%) | |
60-69 Yrs | 846 (10%) | 8062 (11%) | 21205 (11%) | |
70+ Yrs | 802 (10%) | 7730 (10%) | 18569 (10%) | |
Median HH Income | $56,009 | $66,569 | $67,238 | |
Total Household Income | < 24K | 654 (17%) | 4551 (15%) | 12843 (16%) |
25-49K | 881 (24%) | 6304 (21%) | 16139 (20%) | |
50-74K | 840 (23%) | 5429 (18%) | 14127 (18%) | |
75-99K | 739 (20%) | 4569 (15%) | 11050 (14%) | |
100-199K | 342 (9%) | 6346 (21%) | 17598 (22%) | |
200K+ | 191 (5%) | 2093 (7%) | 6237 (7%) | |
Highest Education Level | No Diploma | 560 | 3699 | 9435 |
Diploma or GED | 1307 | 11619 | 27151 | |
Some College | 1416 | 10655 | 25439 | |
Assoc. Degree | 546 | 5204 | 11845 | |
Bachelors Degree | 1274 | 11890 | 35135 | |
Higher Degree | 632 | 5740 | 20253 | |
Total Housing Units | 3,972 | 30,577 | 82,416 | |
--Owner-Occupied | 1,088 | 18,203 | 44,000 | |
--Renter-Occupied | 2,558 | 11,089 | 33,995 | |
Owner-Occupied Values | < 100K | 93 | 801 | 2557 |
100-199K | 314 | 6703 | 13866 | |
200-299K | 222 | 5728 | 13544 | |
300-399K | 160 | 1998 | 6269 | |
400-499K | 155 | 1396 | 3423 | |
500K+ | 143 | 1576 | 4341 | |
Total Working Age Population | 6,665 | 56,739 | 148,695 | |
In Work Force | 4,541 | 39,334 | 103,817 | |
Not In Work Force | 2,124 | 17,405 | 44,878 | |
Workforce Employed | 4,181 | 37,359 | 99,182 | |
Workforce Unemployed | 340 | 1,953 | 4,525 | |
Civlian Workforce | 4,521 | 39,312 | 103,707 | |
Military Workforce | 20 | 21 | 110 | |
Total Households | 3,647 | 29,292 | 77,995 | |
Family Households | 1,719 | 17,520 | 42,845 | |
Non-Family Households | 1,928 | 11,771 | 35,149 | |
Married Couple | 1,174 | 12,487 | 31,227 | |
Other Family | 545 | 5,034 | 11,618 | |
Married w/Child | 387 | 4,637 | 11,937 | |
Single Male w/Child | 81 | 922 | 1,801 | |
Single Female w/Child | 205 | 2,111 | 5,322 |
Population Change Last Two Decades - Plus Projection
2000 | % | 2010 | % | 2020 | % | 2030 | |
---|---|---|---|---|---|---|---|
Minnesota | 4,919,479 | +8 | 5,303,925 | +7 | 5,687,161 | +5 | 5,974,304 |
Dakota County | 355,904 | +12 | 398,552 | +9 | 434,203 | +7 | 463,564 |
Hennepin County | 1,116,200 | +3 | 1,152,425 | +12 | 1,294,371 | +9 | 1,407,332 |
Ramsey County | 511,035 | 0 | 508,640 | +12 | 567,959 | +9 | 616,408 |
Washington County | 201,130 | +18 | 238,136 | +11 | 264,517 | +8 | 285,490 |
Total Working Age Population:
Total Households:
Total Working Age Population:
Total Households:
Total Working Age Population:
Total Households: