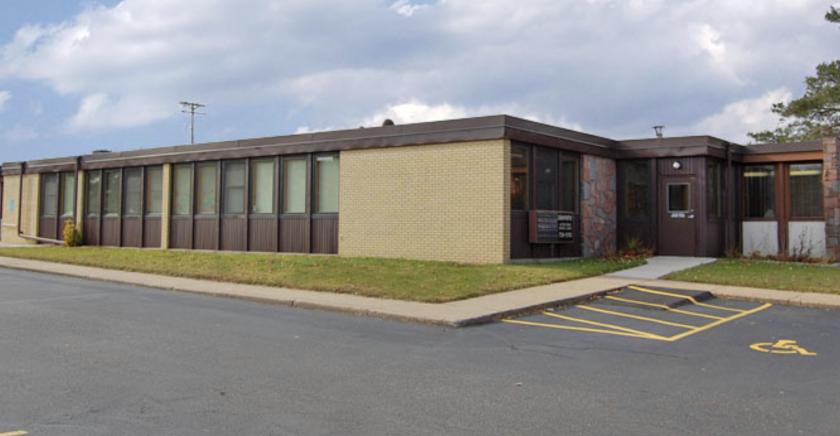
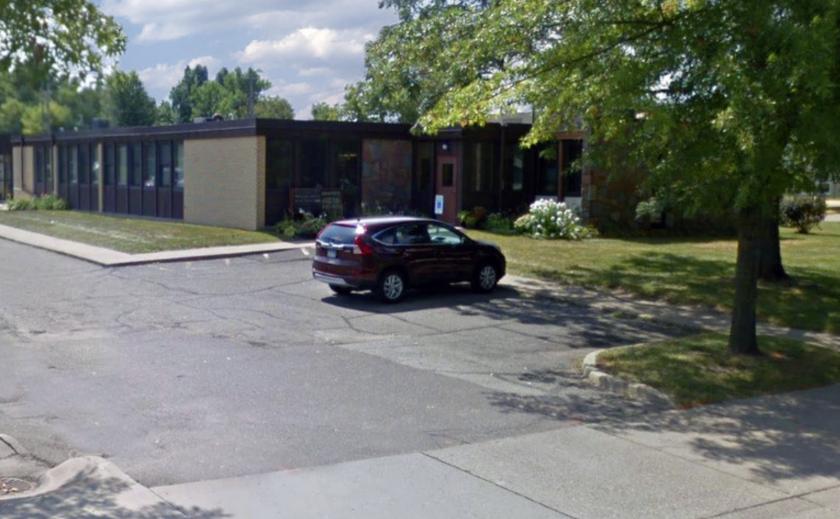
1-Mile | 3-Miles | 5-Miles | ||
---|---|---|---|---|
Total Population | 6,729 | 83,208 | 228,419 | |
Population Median Age | 38 | 37 | 36 | |
Population by Age | 0-9 Yrs | 789 (11%) | 11739 (14%) | 34324 (15%) |
10-19 Yrs | 680 (10%) | 10638 (12%) | 31922 (13%) | |
20-29 Yrs | 1157 (17%) | 12821 (15%) | 33936 (14%) | |
30-39 Yrs | 1263 (18%) | 12732 (15%) | 33833 (14%) | |
40-49 Yrs | 694 (10%) | 9423 (11%) | 26523 (11%) | |
50-59 Yrs | 909 (13%) | 10393 (12%) | 28974 (12%) | |
60-69 Yrs | 606 (9%) | 8587 (10%) | 21980 (9%) | |
70+ Yrs | 630 (9%) | 6875 (8%) | 16927 (7%) | |
Median HH Income | $68,833 | $66,184 | $66,473 | |
Total Household Income | < 24K | 290 (11%) | 4240 (13%) | 13383 (16%) |
25-49K | 508 (19%) | 7022 (22%) | 17176 (20%) | |
50-74K | 632 (24%) | 6033 (19%) | 15224 (18%) | |
75-99K | 393 (15%) | 4506 (14%) | 11139 (13%) | |
100-199K | 703 (26%) | 7851 (25%) | 20120 (24%) | |
200K+ | 77 (2%) | 1271 (4%) | 4857 (5%) | |
Highest Education Level | No Diploma | 347 | 6070 | 17120 |
Diploma or GED | 1299 | 13994 | 36314 | |
Some College | 978 | 10570 | 28846 | |
Assoc. Degree | 492 | 5658 | 14915 | |
Bachelors Degree | 1122 | 12389 | 33001 | |
Higher Degree | 509 | 6383 | 16510 | |
Total Housing Units | 2,662 | 31,928 | 85,497 | |
--Owner-Occupied | 1,782 | 20,457 | 53,911 | |
--Renter-Occupied | 822 | 10,467 | 27,988 | |
Owner-Occupied Values | < 100K | 187 | 1733 | 3732 |
100-199K | 694 | 8195 | 21202 | |
200-299K | 748 | 6566 | 16229 | |
300-399K | 120 | 2764 | 7754 | |
400-499K | 31 | 843 | 2965 | |
500K+ | 2 | 356 | 2029 | |
Total Working Age Population | 5,509 | 65,020 | 174,609 | |
In Work Force | 3,799 | 45,720 | 122,366 | |
Not In Work Force | 1,710 | 19,300 | 52,244 | |
Workforce Employed | 3,659 | 43,797 | 116,785 | |
Workforce Unemployed | 140 | 1,866 | 5,436 | |
Civlian Workforce | 3,799 | 45,663 | 122,221 | |
Military Workforce | 0 | 57 | 145 | |
Total Households | 2,604 | 30,923 | 81,899 | |
Family Households | 1,565 | 19,972 | 53,241 | |
Non-Family Households | 1,039 | 10,952 | 28,658 | |
Married Couple | 1,172 | 13,765 | 36,489 | |
Other Family | 393 | 6,207 | 16,753 | |
Married w/Child | 540 | 5,912 | 17,033 | |
Single Male w/Child | 47 | 926 | 2,738 | |
Single Female w/Child | 119 | 2,376 | 7,394 |
Population Change Last Two Decades - Plus Projection
2000 | % | 2010 | % | 2020 | % | 2030 | |
---|---|---|---|---|---|---|---|
Minnesota | 4,919,479 | +8 | 5,303,925 | +7 | 5,687,161 | +5 | 5,974,304 |
Dakota County | 355,904 | +12 | 398,552 | +9 | 434,203 | +7 | 463,564 |
Ramsey County | 511,035 | 0 | 508,640 | +12 | 567,959 | +9 | 616,408 |
Washington County | 201,130 | +18 | 238,136 | +11 | 264,517 | +8 | 285,490 |
Total Working Age Population:
Total Households:
Total Working Age Population:
Total Households:
Total Working Age Population:
Total Households: