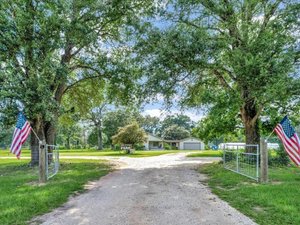
1-Mile | 3-Miles | 5-Miles | ||
---|---|---|---|---|
Total Population | 833 | 16,777 | 42,861 | |
Population Median Age | 42 | 40 | 39 | |
Population by Age | 0-9 Yrs | 54 (6%) | 2008 (11%) | 5796 (13%) |
10-19 Yrs | 82 (9%) | 1962 (11%) | 5500 (12%) | |
20-29 Yrs | 150 (18%) | 2233 (13%) | 5726 (13%) | |
30-39 Yrs | 81 (9%) | 2099 (12%) | 5456 (12%) | |
40-49 Yrs | 92 (11%) | 2009 (11%) | 4675 (10%) | |
50-59 Yrs | 230 (27%) | 2403 (14%) | 5968 (13%) | |
60-69 Yrs | 89 (10%) | 2095 (12%) | 5441 (12%) | |
70+ Yrs | 55 (6%) | 1968 (11%) | 4297 (10%) | |
Median HH Income | $90,377 | $60,623 | $46,828 | |
Total Household Income | < 24K | 33 (10%) | 1413 (21%) | 4065 (26%) |
25-49K | 46 (14%) | 1486 (22%) | 4192 (26%) | |
50-74K | 50 (15%) | 1158 (17%) | 2421 (15%) | |
75-99K | 53 (16%) | 755 (11%) | 1845 (11%) | |
100-199K | 109 (33%) | 1368 (21%) | 2385 (15%) | |
200K+ | 32 (9%) | 319 (4%) | 656 (4%) | |
Highest Education Level | No Diploma | 81 | 1900 | 5528 |
Diploma or GED | 182 | 3944 | 9600 | |
Some College | 188 | 3054 | 7291 | |
Assoc. Degree | 85 | 1174 | 2548 | |
Bachelors Degree | 68 | 1368 | 2913 | |
Higher Degree | 36 | 432 | 1159 | |
Total Housing Units | 371 | 7,217 | 18,425 | |
--Owner-Occupied | 258 | 4,494 | 9,380 | |
--Renter-Occupied | 64 | 2,006 | 6,185 | |
Owner-Occupied Values | < 100K | 6 | 1327 | 3492 |
100-199K | 143 | 2208 | 4048 | |
200-299K | 69 | 639 | 1159 | |
300-399K | 24 | 189 | 327 | |
400-499K | 8 | 75 | 206 | |
500K+ | 8 | 56 | 148 | |
Total Working Age Population | 741 | 13,429 | 33,507 | |
In Work Force | 504 | 8,368 | 20,104 | |
Not In Work Force | 237 | 5,060 | 13,402 | |
Workforce Employed | 481 | 7,726 | 18,292 | |
Workforce Unemployed | 23 | 563 | 1,696 | |
Civlian Workforce | 504 | 8,288 | 19,988 | |
Military Workforce | 0 | 80 | 116 | |
Total Households | 322 | 6,500 | 15,564 | |
Family Households | 259 | 4,828 | 11,033 | |
Non-Family Households | 63 | 1,672 | 4,531 | |
Married Couple | 198 | 3,248 | 6,866 | |
Other Family | 61 | 1,579 | 4,167 | |
Married w/Child | 33 | 945 | 2,193 | |
Single Male w/Child | 4 | 188 | 366 | |
Single Female w/Child | 29 | 587 | 1,600 |
Population Change Last Two Decades - Plus Projection
2000 | % | 2010 | % | 2020 | % | 2030 | |
---|---|---|---|---|---|---|---|
Texas | 20,851,820 | +21 | 25,145,561 | +18 | 29,677,668 | +18 | 34,894,452 |
Chambers County | 26,031 | +35 | 35,096 | +21 | 42,320 | +24 | 52,605 |
Galveston County | 250,158 | +16 | 291,309 | +22 | 355,196 | +20 | 427,028 |
Harris County | 3,400,578 | +20 | 4,092,459 | +22 | 4,978,845 | +19 | 5,924,750 |
Total Working Age Population:
Total Households:
Total Working Age Population:
Total Households:
Total Working Age Population:
Total Households: