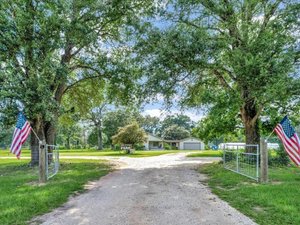
1-Mile | 3-Miles | 5-Miles | ||
---|---|---|---|---|
Total Population | 802 | 21,613 | 44,348 | |
Population Median Age | 42 | 39 | 38 | |
Population by Age | 0-9 Yrs | 49 (6%) | 2923 (13%) | 6061 (13%) |
10-19 Yrs | 78 (9%) | 2581 (11%) | 5673 (12%) | |
20-29 Yrs | 145 (18%) | 2933 (13%) | 6022 (13%) | |
30-39 Yrs | 77 (9%) | 2684 (12%) | 5653 (12%) | |
40-49 Yrs | 88 (10%) | 2480 (11%) | 4863 (10%) | |
50-59 Yrs | 225 (28%) | 3042 (14%) | 6101 (13%) | |
60-69 Yrs | 86 (10%) | 2557 (11%) | 5556 (12%) | |
70+ Yrs | 53 (6%) | 2415 (11%) | 4419 (9%) | |
Median HH Income | $91,867 | $54,688 | $46,947 | |
Total Household Income | < 24K | 29 (9%) | 1745 (21%) | 4157 (25%) |
25-49K | 43 (13%) | 2031 (25%) | 4365 (27%) | |
50-74K | 48 (15%) | 1426 (17%) | 2531 (15%) | |
75-99K | 51 (16%) | 928 (11%) | 1908 (11%) | |
100-199K | 107 (34%) | 1485 (18%) | 2417 (15%) | |
200K+ | 32 (10%) | 399 (4%) | 679 (4%) | |
Highest Education Level | No Diploma | 77 | 2543 | 5719 |
Diploma or GED | 177 | 4997 | 9923 | |
Some College | 181 | 3767 | 7486 | |
Assoc. Degree | 83 | 1406 | 2588 | |
Bachelors Degree | 66 | 1609 | 3051 | |
Higher Degree | 35 | 536 | 1186 | |
Total Housing Units | 358 | 8,868 | 19,053 | |
--Owner-Occupied | 253 | 5,157 | 9,591 | |
--Renter-Occupied | 57 | 2,858 | 6,466 | |
Owner-Occupied Values | < 100K | 6 | 1683 | 3669 |
100-199K | 140 | 2490 | 4069 | |
200-299K | 68 | 668 | 1153 | |
300-399K | 23 | 189 | 336 | |
400-499K | 8 | 75 | 206 | |
500K+ | 8 | 51 | 158 | |
Total Working Age Population | 718 | 16,870 | 34,612 | |
In Work Force | 488 | 10,358 | 20,778 | |
Not In Work Force | 229 | 6,512 | 13,834 | |
Workforce Employed | 466 | 9,559 | 18,927 | |
Workforce Unemployed | 22 | 719 | 1,735 | |
Civlian Workforce | 488 | 10,278 | 20,662 | |
Military Workforce | 0 | 80 | 116 | |
Total Households | 310 | 8,015 | 16,057 | |
Family Households | 251 | 5,872 | 11,359 | |
Non-Family Households | 59 | 2,143 | 4,698 | |
Married Couple | 193 | 3,742 | 6,990 | |
Other Family | 58 | 2,130 | 4,368 | |
Married w/Child | 31 | 1,156 | 2,257 | |
Single Male w/Child | 4 | 253 | 381 | |
Single Female w/Child | 28 | 740 | 1,691 |
Population Change Last Two Decades - Plus Projection
2000 | % | 2010 | % | 2020 | % | 2030 | |
---|---|---|---|---|---|---|---|
Texas | 20,851,820 | +21 | 25,145,561 | +18 | 29,677,668 | +18 | 34,894,452 |
Chambers County | 26,031 | +35 | 35,096 | +21 | 42,320 | +24 | 52,605 |
Galveston County | 250,158 | +16 | 291,309 | +22 | 355,196 | +20 | 427,028 |
Harris County | 3,400,578 | +20 | 4,092,459 | +22 | 4,978,845 | +19 | 5,924,750 |
Total Working Age Population:
Total Households:
Total Working Age Population:
Total Households:
Total Working Age Population:
Total Households: