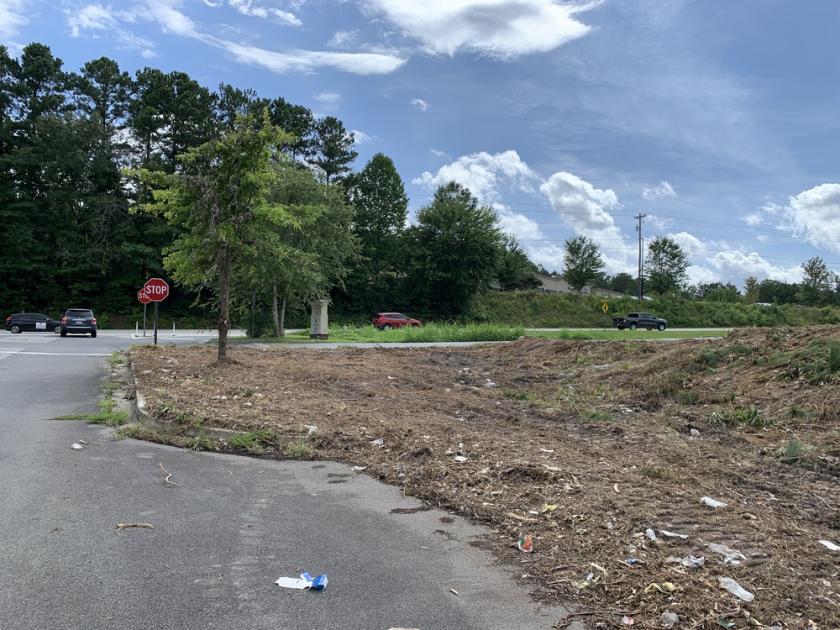
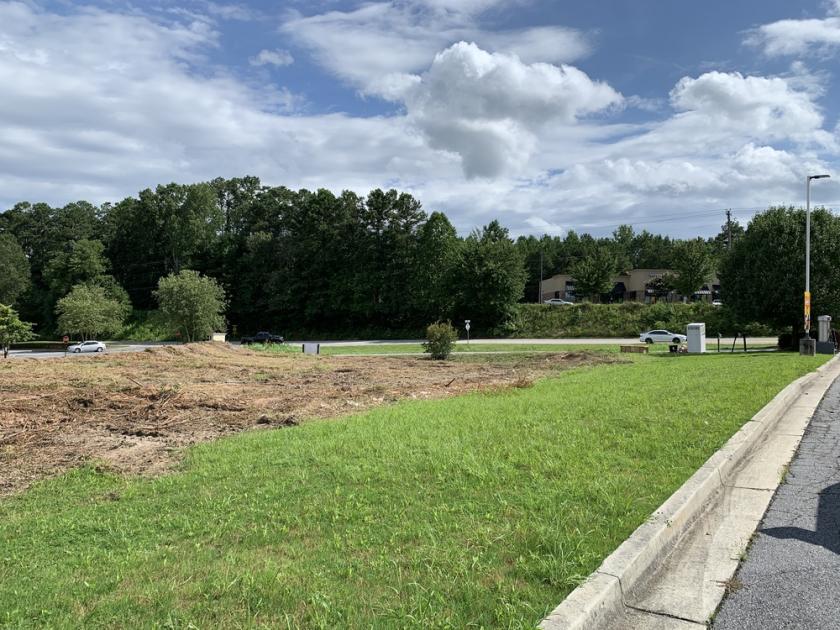
1-Mile | 3-Miles | 5-Miles | ||
---|---|---|---|---|
Total Population | 3,441 | 28,450 | 75,906 | |
Population Median Age | 36 | 36 | 36 | |
Population by Age | 0-9 Yrs | 395 (11%) | 3453 (12%) | 10215 (13%) |
10-19 Yrs | 580 (16%) | 4927 (17%) | 12410 (16%) | |
20-29 Yrs | 461 (13%) | 3701 (13%) | 8957 (11%) | |
30-39 Yrs | 529 (15%) | 4129 (14%) | 10174 (13%) | |
40-49 Yrs | 465 (13%) | 4023 (14%) | 10696 (14%) | |
50-59 Yrs | 477 (13%) | 3811 (13%) | 10802 (14%) | |
60-69 Yrs | 337 (9%) | 2547 (8%) | 7128 (9%) | |
70+ Yrs | 196 (5%) | 1859 (6%) | 5523 (7%) | |
Median HH Income | $72,922 | $73,122 | $75,312 | |
Total Household Income | < 24K | 169 (15%) | 1402 (15%) | 3406 (13%) |
25-49K | 186 (17%) | 1608 (17%) | 4868 (19%) | |
50-74K | 208 (19%) | 1635 (18%) | 4269 (16%) | |
75-99K | 174 (15%) | 1411 (15%) | 3304 (13%) | |
100-199K | 320 (29%) | 2650 (29%) | 7423 (29%) | |
200K+ | 35 (3%) | 343 (3%) | 1898 (7%) | |
Highest Education Level | No Diploma | 312 | 2329 | 4842 |
Diploma or GED | 704 | 5898 | 14101 | |
Some College | 559 | 4550 | 11833 | |
Assoc. Degree | 185 | 1377 | 3689 | |
Bachelors Degree | 302 | 2662 | 9717 | |
Higher Degree | 162 | 1397 | 4916 | |
Total Housing Units | 1,113 | 9,352 | 26,453 | |
--Owner-Occupied | 808 | 6,873 | 19,427 | |
--Renter-Occupied | 283 | 2,175 | 5,741 | |
Owner-Occupied Values | < 100K | 90 | 753 | 1691 |
100-199K | 419 | 3206 | 7117 | |
200-299K | 209 | 1959 | 5339 | |
300-399K | 73 | 745 | 3121 | |
400-499K | 11 | 99 | 1110 | |
500K+ | 6 | 110 | 1049 | |
Total Working Age Population | 2,723 | 22,152 | 58,154 | |
In Work Force | 1,754 | 14,200 | 37,608 | |
Not In Work Force | 969 | 7,952 | 20,546 | |
Workforce Employed | 1,672 | 13,637 | 36,131 | |
Workforce Unemployed | 82 | 552 | 1,432 | |
Civlian Workforce | 1,754 | 14,189 | 37,563 | |
Military Workforce | 0 | 11 | 45 | |
Total Households | 1,091 | 9,049 | 25,168 | |
Family Households | 831 | 7,134 | 20,209 | |
Non-Family Households | 260 | 1,915 | 4,959 | |
Married Couple | 655 | 5,527 | 15,652 | |
Other Family | 176 | 1,607 | 4,557 | |
Married w/Child | 299 | 2,683 | 7,486 | |
Single Male w/Child | 22 | 178 | 447 | |
Single Female w/Child | 69 | 585 | 1,941 |
Population Change Last Two Decades - Plus Projection
2000 | % | 2010 | % | 2020 | % | 2030 | |
---|---|---|---|---|---|---|---|
Georgia | 8,186,453 | +18 | 9,687,653 | +12 | 10,833,472 | +13 | 12,292,423 |
Cobb County | 607,751 | +13 | 688,078 | +15 | 790,588 | +19 | 938,747 |
Fulton County | 816,006 | +13 | 920,581 | +19 | 1,099,181 | +18 | 1,300,861 |
Paulding County | 81,678 | +74 | 142,324 | +21 | 172,542 | +21 | 208,525 |
Total Working Age Population:
Total Households:
Total Working Age Population:
Total Households:
Total Working Age Population:
Total Households: