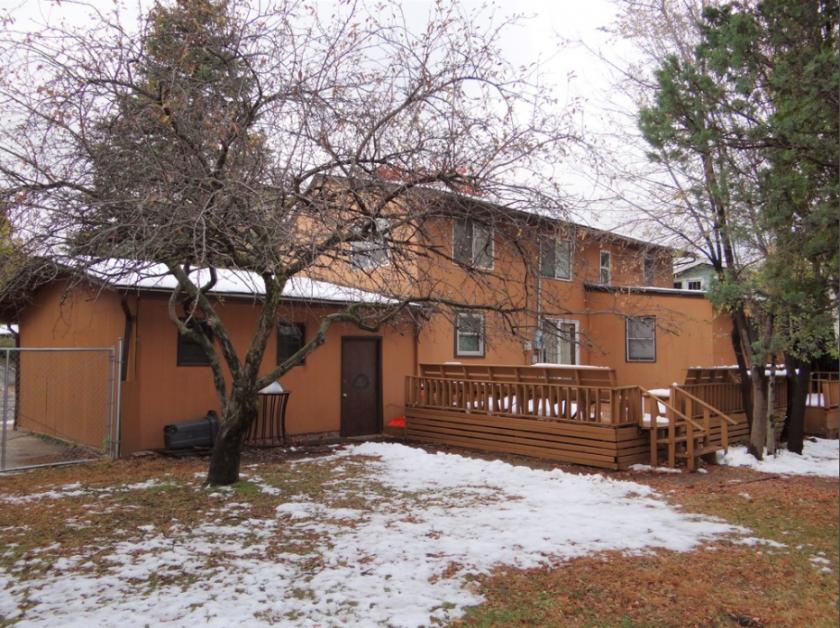
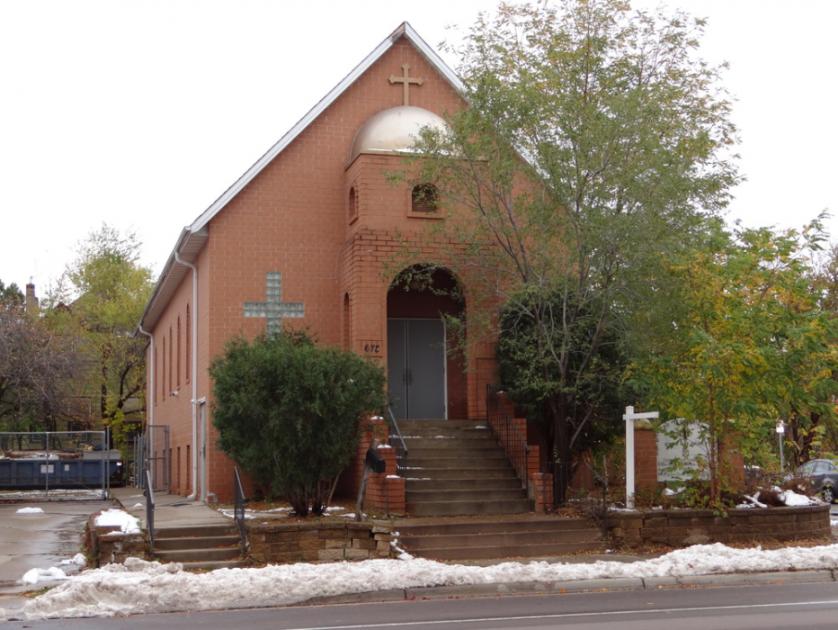
1-Mile | 3-Miles | 5-Miles | ||
---|---|---|---|---|
Total Population | 16,015 | 114,101 | 338,195 | |
Population Median Age | 33 | 37 | 35 | |
Population by Age | 0-9 Yrs | 2621 (16%) | 15482 (13%) | 48733 (14%) |
10-19 Yrs | 2373 (14%) | 13674 (11%) | 45087 (13%) | |
20-29 Yrs | 2728 (17%) | 19188 (16%) | 56698 (16%) | |
30-39 Yrs | 2380 (14%) | 18006 (15%) | 53663 (15%) | |
40-49 Yrs | 1784 (11%) | 12745 (11%) | 37668 (11%) | |
50-59 Yrs | 1861 (11%) | 13532 (11%) | 39610 (11%) | |
60-69 Yrs | 1399 (8%) | 11593 (10%) | 31893 (9%) | |
70+ Yrs | 868 (5%) | 9881 (8%) | 24844 (7%) | |
Median HH Income | $55,796 | $56,277 | $58,636 | |
Total Household Income | < 24K | 1268 (21%) | 10677 (22%) | 25722 (20%) |
25-49K | 1411 (23%) | 10441 (22%) | 28998 (22%) | |
50-74K | 1180 (19%) | 8740 (18%) | 23830 (18%) | |
75-99K | 772 (12%) | 5592 (11%) | 16859 (13%) | |
100-199K | 1155 (19%) | 8875 (18%) | 24988 (19%) | |
200K+ | 241 (3%) | 2603 (5%) | 7299 (5%) | |
Highest Education Level | No Diploma | 1270 | 9172 | 28639 |
Diploma or GED | 2680 | 17231 | 48984 | |
Some College | 2134 | 15523 | 42214 | |
Assoc. Degree | 878 | 6063 | 18469 | |
Bachelors Degree | 1986 | 18532 | 50370 | |
Higher Degree | 949 | 10794 | 30769 | |
Total Housing Units | 6,440 | 50,332 | 135,670 | |
--Owner-Occupied | 3,554 | 22,395 | 67,584 | |
--Renter-Occupied | 2,473 | 24,532 | 60,113 | |
Owner-Occupied Values | < 100K | 189 | 1700 | 4943 |
100-199K | 2102 | 9546 | 27798 | |
200-299K | 1026 | 6224 | 18793 | |
300-399K | 129 | 2200 | 7443 | |
400-499K | 46 | 1097 | 3916 | |
500K+ | 63 | 1627 | 4689 | |
Total Working Age Population | 11,951 | 90,234 | 261,833 | |
In Work Force | 8,975 | 62,004 | 182,316 | |
Not In Work Force | 2,975 | 28,230 | 79,517 | |
Workforce Employed | 8,349 | 58,440 | 173,009 | |
Workforce Unemployed | 626 | 3,549 | 9,188 | |
Civlian Workforce | 8,975 | 61,989 | 182,197 | |
Military Workforce | 0 | 15 | 119 | |
Total Households | 6,028 | 46,928 | 127,696 | |
Family Households | 3,658 | 23,845 | 72,874 | |
Non-Family Households | 2,370 | 23,083 | 54,822 | |
Married Couple | 2,085 | 15,453 | 47,979 | |
Other Family | 1,573 | 8,392 | 24,895 | |
Married w/Child | 1,019 | 6,281 | 21,545 | |
Single Male w/Child | 303 | 1,214 | 3,574 | |
Single Female w/Child | 800 | 4,135 | 11,357 |
Population Change Last Two Decades - Plus Projection
2000 | % | 2010 | % | 2020 | % | 2030 | |
---|---|---|---|---|---|---|---|
Minnesota | 4,919,479 | +8 | 5,303,925 | +7 | 5,687,161 | +5 | 5,974,304 |
Dakota County | 355,904 | +12 | 398,552 | +9 | 434,203 | +7 | 463,564 |
Hennepin County | 1,116,200 | +3 | 1,152,425 | +12 | 1,294,371 | +9 | 1,407,332 |
Ramsey County | 511,035 | 0 | 508,640 | +12 | 567,959 | +9 | 616,408 |
Washington County | 201,130 | +18 | 238,136 | +11 | 264,517 | +8 | 285,490 |
Total Working Age Population:
Total Households:
Total Working Age Population:
Total Households:
Total Working Age Population:
Total Households: