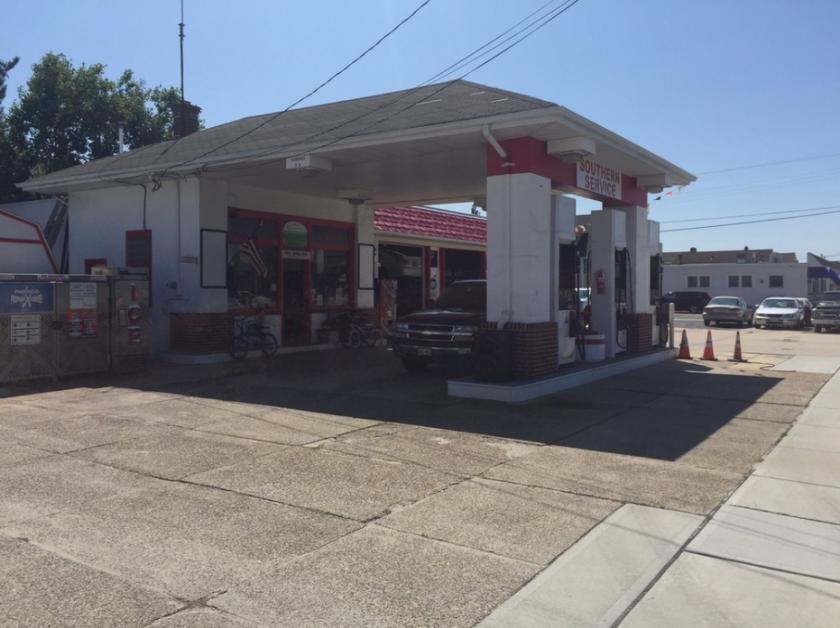
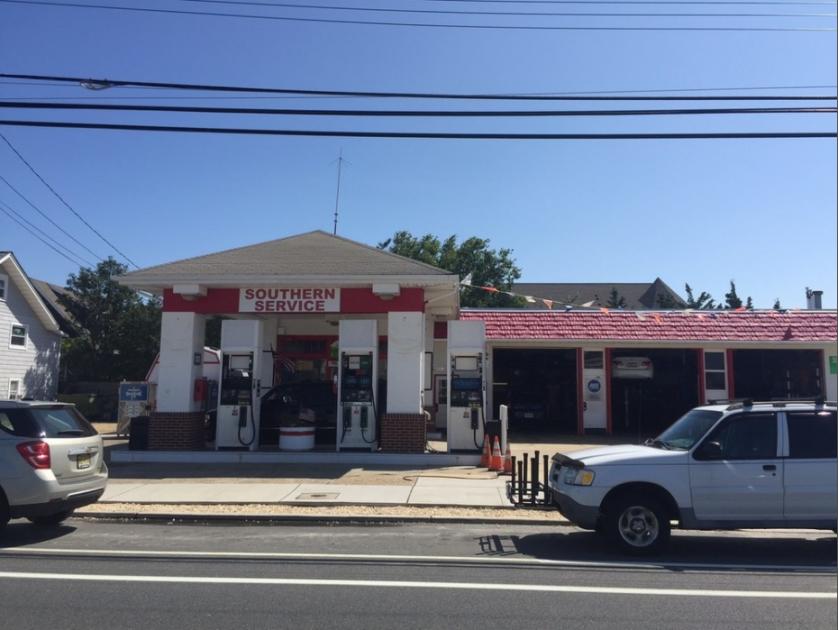
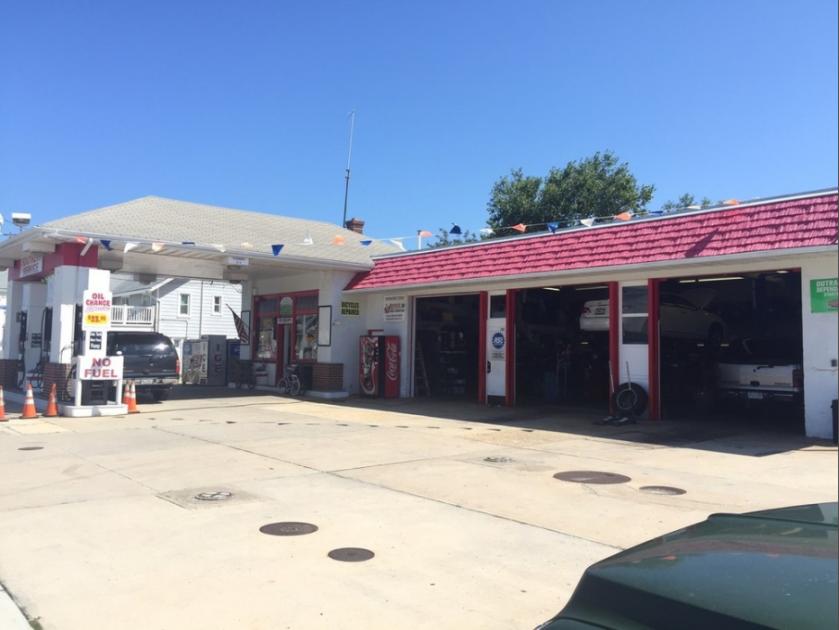
1-Mile | 3-Miles | 5-Miles | ||
---|---|---|---|---|
Total Population | 5,102 | 27,020 | 72,609 | |
Population Median Age | 50 | 46 | 44 | |
Population by Age | 0-9 Yrs | 343 (6%) | 2191 (8%) | 6976 (9%) |
10-19 Yrs | 291 (5%) | 2246 (8%) | 7803 (10%) | |
20-29 Yrs | 708 (13%) | 3116 (11%) | 8263 (11%) | |
30-39 Yrs | 555 (10%) | 3178 (11%) | 8347 (11%) | |
40-49 Yrs | 282 (5%) | 3062 (11%) | 8710 (11%) | |
50-59 Yrs | 608 (11%) | 3873 (14%) | 10292 (14%) | |
60-69 Yrs | 934 (18%) | 4604 (17%) | 11361 (15%) | |
70+ Yrs | 1380 (27%) | 4750 (17%) | 10855 (14%) | |
Median HH Income | $70,288 | $79,947 | $80,324 | |
Total Household Income | < 24K | 380 (13%) | 1803 (14%) | 3880 (12%) |
25-49K | 410 (14%) | 1962 (15%) | 5177 (16%) | |
50-74K | 716 (25%) | 2161 (16%) | 5173 (16%) | |
75-99K | 444 (15%) | 2358 (18%) | 5291 (17%) | |
100-199K | 558 (19%) | 3247 (25%) | 8305 (27%) | |
200K+ | 307 (10%) | 1254 (9%) | 2889 (9%) | |
Highest Education Level | No Diploma | 43 | 1091 | 2995 |
Diploma or GED | 784 | 5805 | 17653 | |
Some College | 706 | 3989 | 10061 | |
Assoc. Degree | 355 | 1566 | 4506 | |
Bachelors Degree | 1252 | 5099 | 11816 | |
Higher Degree | 1062 | 3356 | 6856 | |
Total Housing Units | 9,125 | 30,948 | 58,490 | |
--Owner-Occupied | 2,171 | 9,574 | 24,151 | |
--Renter-Occupied | 644 | 3,211 | 6,565 | |
Owner-Occupied Values | < 100K | 0 | 78 | 292 |
100-199K | 39 | 1018 | 2934 | |
200-299K | 31 | 1563 | 6290 | |
300-399K | 310 | 1550 | 4334 | |
400-499K | 199 | 1477 | 3058 | |
500K+ | 1592 | 3888 | 7242 | |
Total Working Age Population | 4,553 | 23,467 | 60,737 | |
In Work Force | 2,594 | 14,173 | 38,127 | |
Not In Work Force | 1,959 | 9,294 | 22,610 | |
Workforce Employed | 2,376 | 13,479 | 36,226 | |
Workforce Unemployed | 218 | 693 | 1,881 | |
Civlian Workforce | 2,594 | 14,173 | 38,107 | |
Military Workforce | 0 | 0 | 20 | |
Total Households | 2,815 | 12,784 | 30,716 | |
Family Households | 1,493 | 7,123 | 19,216 | |
Non-Family Households | 1,323 | 5,661 | 11,500 | |
Married Couple | 1,113 | 5,448 | 14,522 | |
Other Family | 380 | 1,675 | 4,695 | |
Married w/Child | 221 | 1,421 | 4,547 | |
Single Male w/Child | 11 | 100 | 477 | |
Single Female w/Child | 190 | 647 | 1,636 |
Population Change Last Two Decades - Plus Projection
2000 | % | 2010 | % | 2020 | % | 2030 | |
---|---|---|---|---|---|---|---|
New Jersey | 8,414,350 | +4 | 8,791,894 | +4 | 9,132,700 | +4 | 9,530,900 |
Ocean County | 510,916 | +13 | 576,567 | +4 | 600,300 | +7 | 644,100 |
Total Working Age Population:
Total Households:
Total Working Age Population:
Total Households:
Total Working Age Population:
Total Households: