Industrial Properties
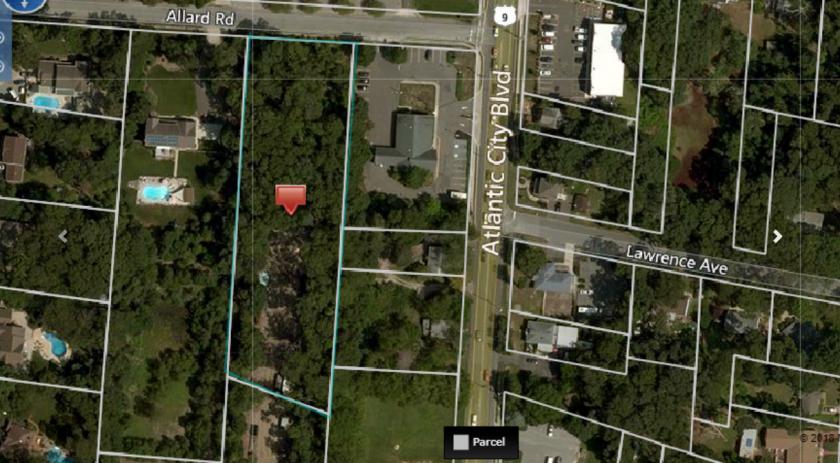
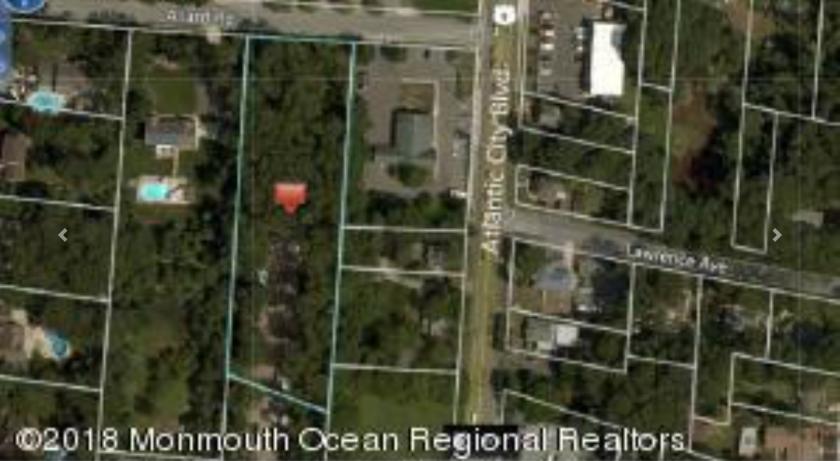
0 Allard Rd Toms River, NJ 08757
0 Allard Rd Toms River, NJ 08757
Details & Description
Listing Agents

Michael Little
KW Commercial
O: 732-797-9001
M: 732-267-3980
mikelittle@kwcommercial.com
KW Commercial
O: 732-797-9001
M: 732-267-3980
mikelittle@kwcommercial.com
While we strive to provide the most accurate information, all listing information, and demographic data, is provided by third-parties. As such, MyEListing will not be responsible for the accuracy of the information. It is strongly recommended that you verify all information with the listing agent, and any relevant agencies, prior to making any decisions.