Live the History in Your New Office > St Pete's Premier Walk-Up Office Suites
Moving on Up, are you looking to bring your Office to Downtown St Pete and on Central Avenue? The opportunity is here and now.
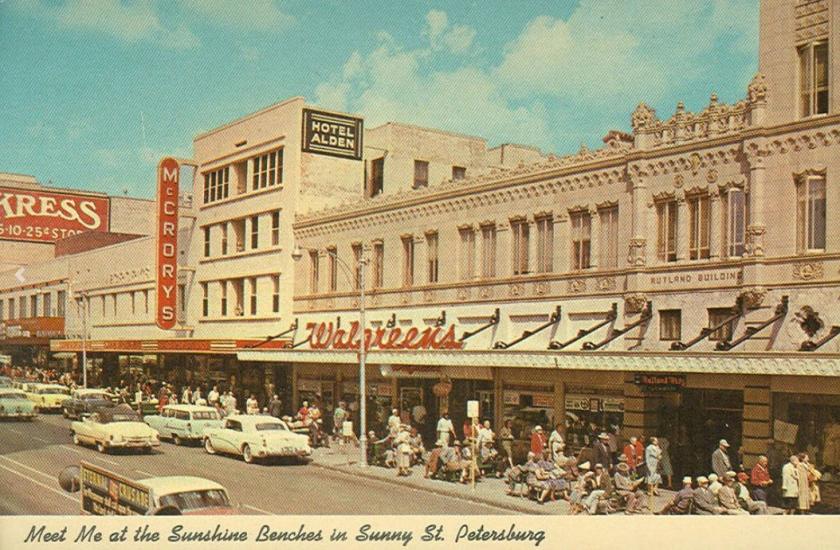
Our Offering is for trendy walk-up office suites in the distinguished historical Alden Hotel and the McCrory's Building. The Site is very easy to access with street parking then to an elevator or stairs to the second floor - very easy in & out.
Spaces vary from a micro office of 350 sf to units of 601 sf, 1233 sf, 914 sf.
The building boasts of attractive lobbies, restrooms, wood floors, and nice finishes. Signage and marquees are available.
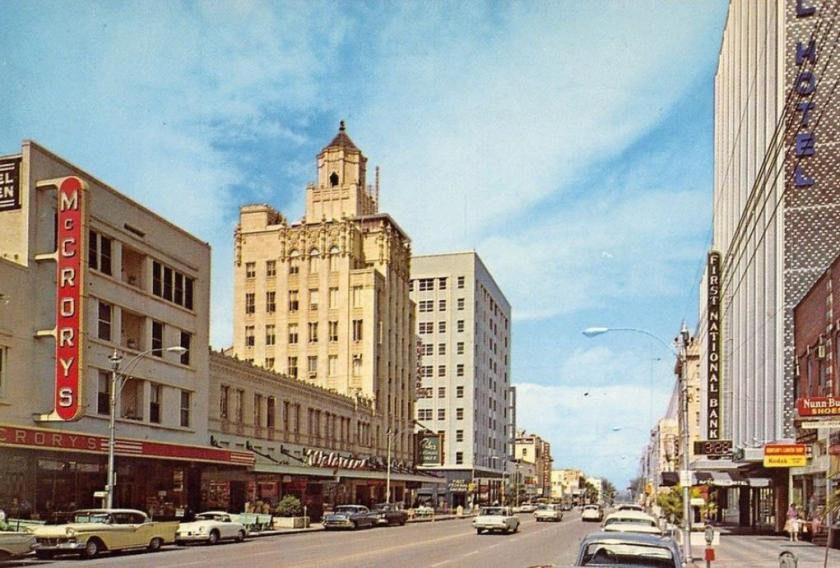
Location Description: Simply a superb location - The address is 433 Central which is on the northside the 400 block of Central Avenue between 4th Street North and 5th Street North.
The 429 Central translates to a Central Avenue and 4th Street North address, two of the most well know corridors in St Pete. 4th Street is considered St Pete's most popular commercial highway and Central Avenue is St Pete's Main Street. The Site is in the 400 Block Dining District which is across the street from one of St Pete's largest developments - New Towers form the Big Apple Development Group featuring the Marriott Hotel.
The Address is the middle of all the key districts of Downtown - walking distance to Beach Drive, the Jannus Block, 600 Block Shopping & Dining District, and the Edge.
The Site is only 1 minute from the Interstate, 7 minutes from the Beaches, 10 minutes to the Skyway Bridge, 15 minutes to Tampa.
The location is only minutes from many of St Pete's key neighborhoods such Old Northeast, Snell Isle, Uptown, Kenwood, Shore Acres, Old Southeast, Tropical Shores, Coquina Key, Driftwood, Pink Streets, St Paul-Euclid, and Allendale