Available 3,125 SF
Zoned Planned Commercial
Highway 84 Frontage 90
Excellent Visibility
Old McGregor Road 8,400 VehiclesDay TxDOT 2019
Total Improvements 6,426 SF
H&A Commercial Team - KW Commercial would like to present this commercial real estate property for lease!
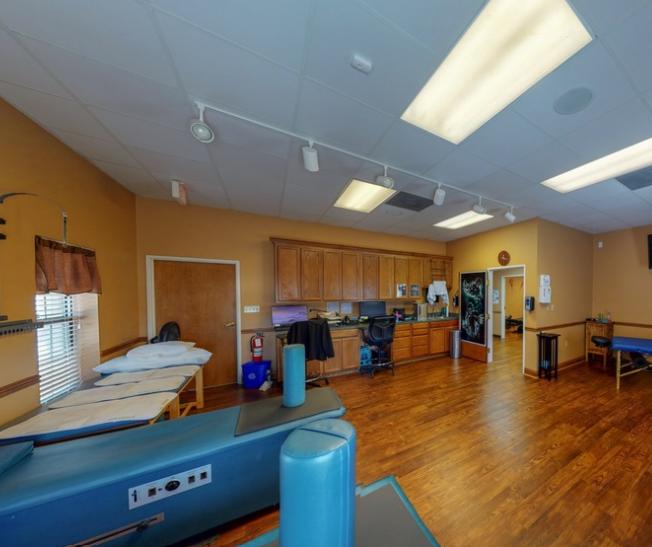
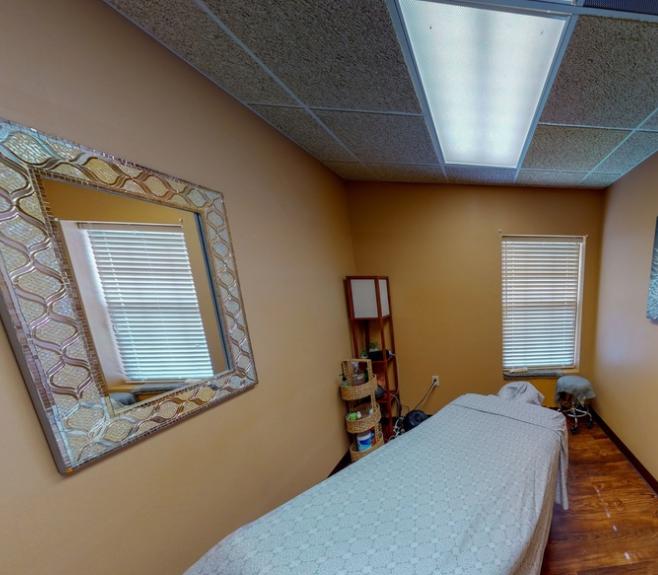
Currently operating as a chiropractic office, our newest lease property is ideal for any medical or office needs. Located at 8300 Old McGregor Road this 3,125 SF space is in a superb spot nestled among other established businesses.
There is ± 175’ of frontage on Old McGregor Road and ± 90’ frontage on Highway 84 making it easily accessible. According to a 2019 TxDOT Study, 44,000+ vehicles per day pass on Highway 84 and 8,400+ vehicles per day on Old McGregor Road enhance the great visibility this property provides.
This property is located in Woodway, Texas just outside of Waco. The Waco Metropolitan Statistical Area has a population of over 270,000 people. The City of Waco is located approximately 90 miles south of the Dallas/Fort Worth area and about 100 minutes north of Austin, Texas.
For more information on this property, or any of our other properties, please contact the H&A Commercial Team – KW Commercial!
No part of this information may be copied, reproduced, repurposed, or screen-captured for any commercial purpose without prior written authorization from MyEListing.
While we strive to provide the most accurate information, all listing information, and demographic data, is provided by third-parties. As such, MyEListing will not be responsible for the accuracy of the information. It is strongly recommended that you verify all information with the listing agent, and any relevant agencies, prior to making any decisions.
What is the asking price for 8300 Old McGregor Road in Waco?
The asking price for 8300 Old McGregor Road is $18.00 a SF per Year
What is the building size of this commercial Office property?
The size of this lease property at '.8300 Old McGregor Road.' is 3125 square feet
What kind of Office is the propery at 8300 Old McGregor Road?
The property at 8300 Old McGregor Road Waco, TX 76712 is listed as a Medical Office property
What is the population within 1 mile of 8300 Old McGregor Road in Waco?
The population within 1 mile of 8300 Old McGregor Road Waco, TX 76712 is 4,599 people.
Who do I contact for questions about 8300 Old McGregor Road?
You should contact the listing agent,
Brad Harrell, for any details regarding this commercial listing.