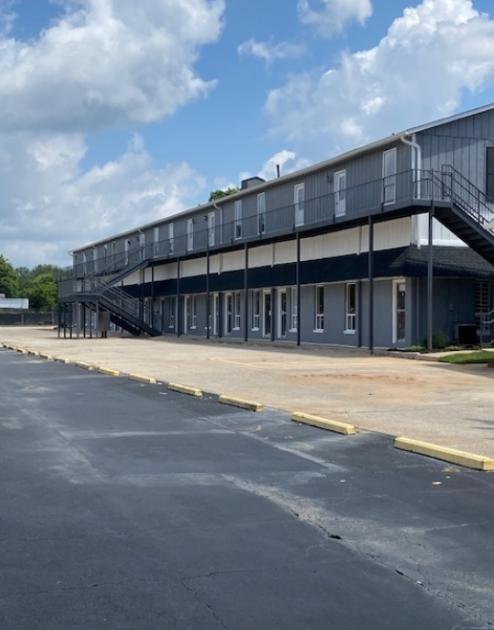
Office Space
112 Norcross Street Roswell, GA 30075
112 Norcross Street Roswell, GA 30075
Details & Description
Property Highlights
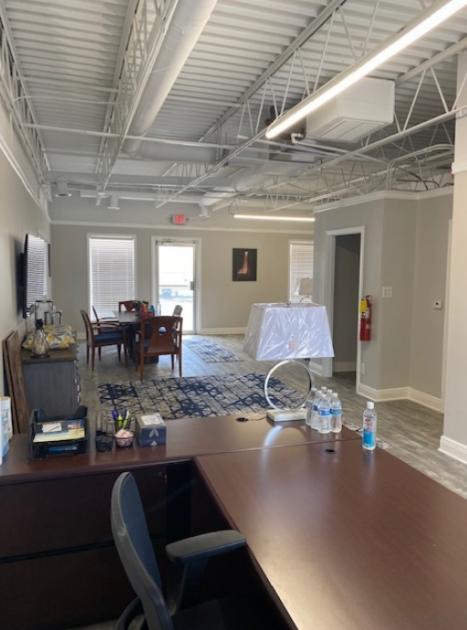
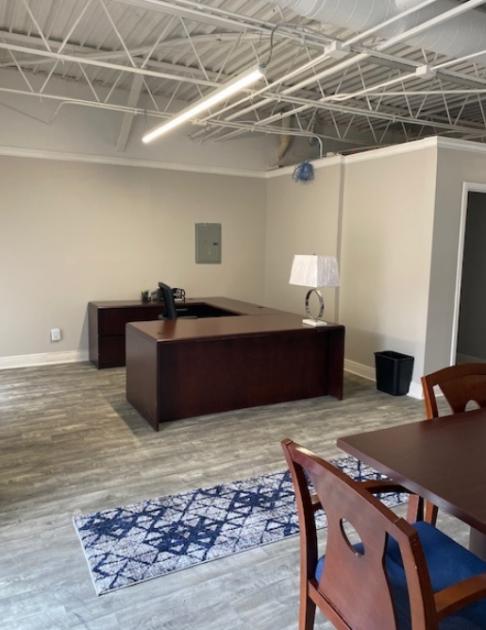
- • Completely renovated and updated
- • Roswell Opportunity Zone
- • New Ownership
- • Ample parking
Additional Photos
Listing Agents

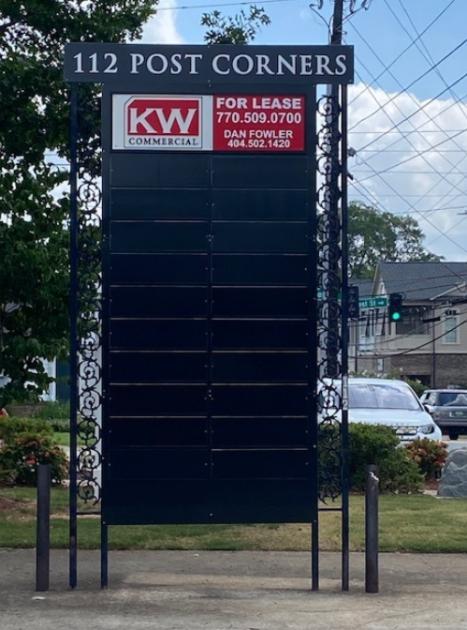
Dan Fowler
KW Commercial
O: 404-502-1420
danieljfowler@comcast.net
KW Commercial
O: 404-502-1420
danieljfowler@comcast.net
While we strive to provide the most accurate information, all listing information, and demographic data, is provided by third-parties. As such, MyEListing will not be responsible for the accuracy of the information. It is strongly recommended that you verify all information with the listing agent, and any relevant agencies, prior to making any decisions.


