Industrial Properties
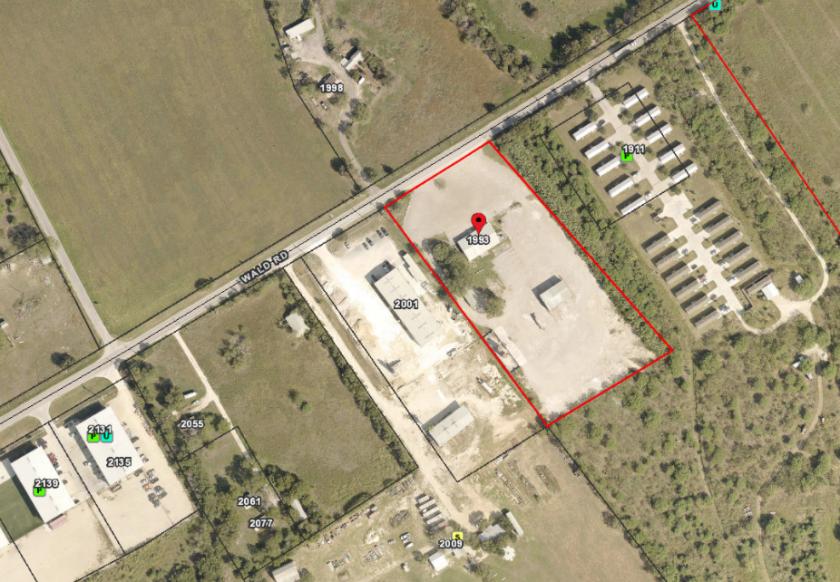
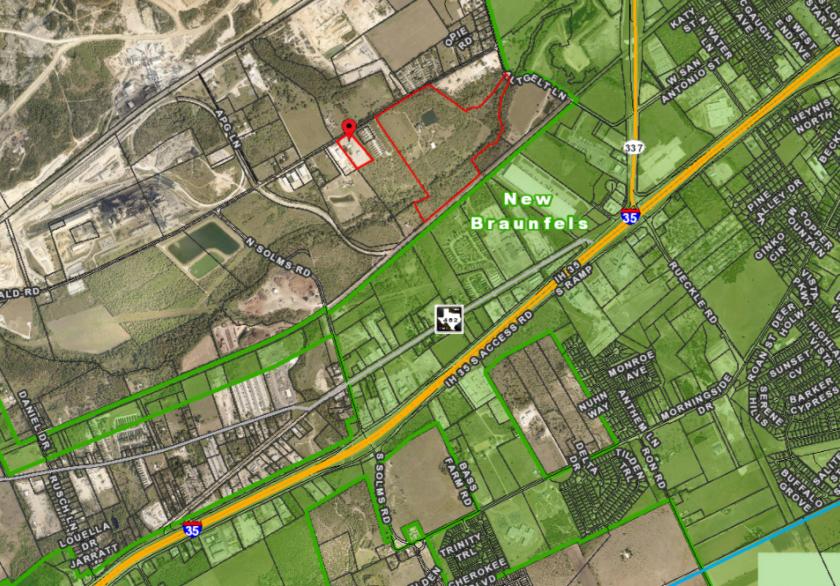
1993 Wald Road New Braunfels, TX 78132
1993 Wald Road New Braunfels, TX 78132
Details & Description
Property Highlights
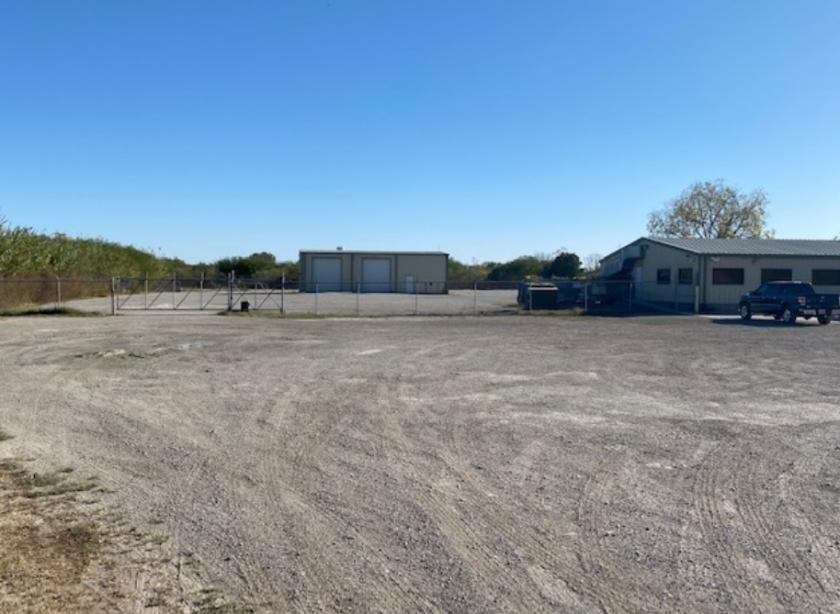
• 2,400 Sf Shop back in the Storage Yard- Includes small Office, restroom, storeroom and 4 Surface Bay Doors
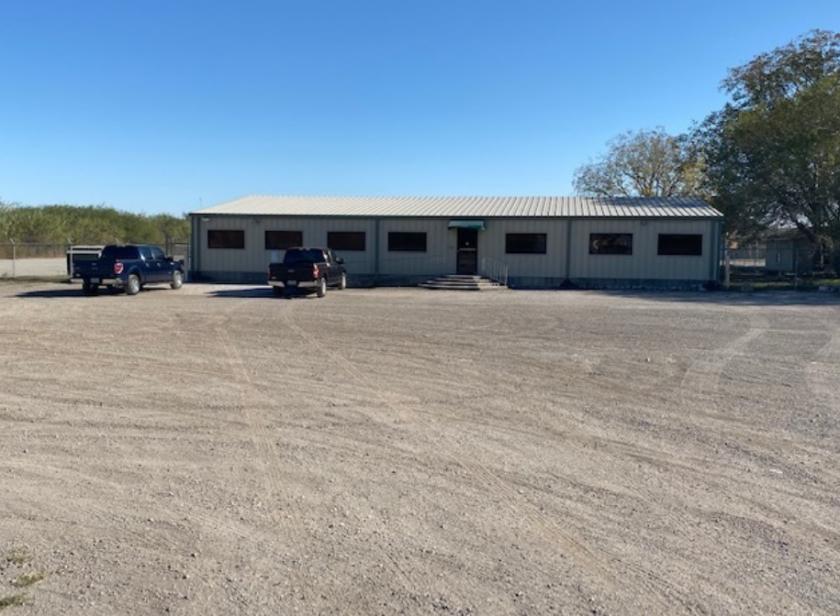
• 4,000 Sf Metal Office Building- 8 Offices, Large Break Rm, Two Restrooms and Plent Open Space and Storage
Additional Photos

Listing Agents

Scott Forester
M: 830-708-1340
scott.forester@kw.com
M: 830-708-1340
scott.forester@kw.com
While we strive to provide the most accurate information, all listing information, and demographic data, is provided by third-parties. As such, MyEListing will not be responsible for the accuracy of the information. It is strongly recommended that you verify all information with the listing agent, and any relevant agencies, prior to making any decisions.


