Specialty Real Estate
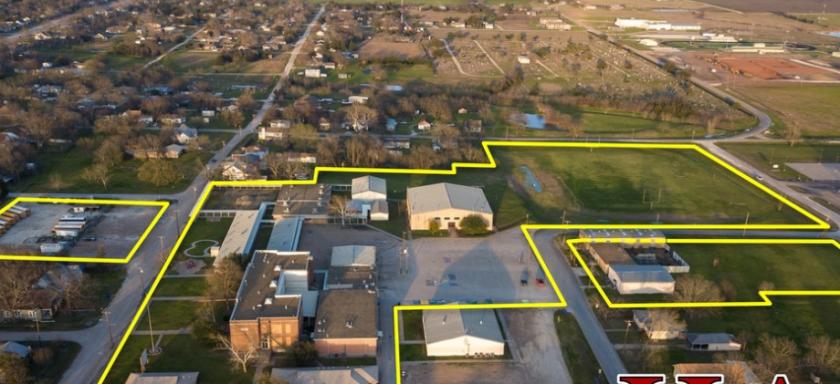
700 East Navarro Street Mart, TX 76664
700 East Navarro Street Mart, TX 76664

Details & Description
Listing Agents

Brad Harrell
O: 254-265-7220
M: 254-749-7551
commercial@harrellteam.realestate
O: 254-265-7220
M: 254-749-7551
commercial@harrellteam.realestate
While we strive to provide the most accurate information, all listing information, and demographic data, is provided by third-parties. As such, MyEListing will not be responsible for the accuracy of the information. It is strongly recommended that you verify all information with the listing agent, and any relevant agencies, prior to making any decisions.