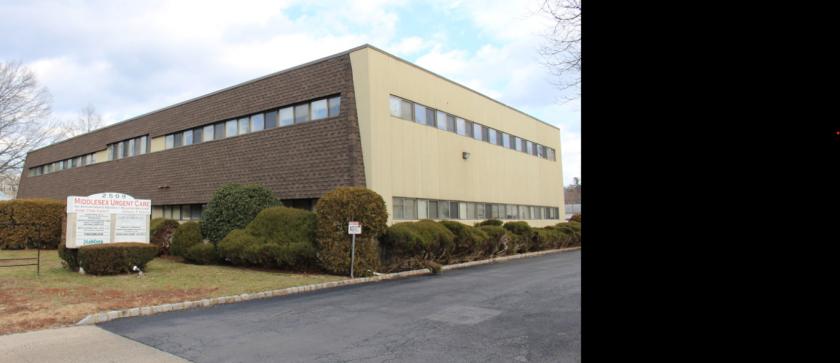
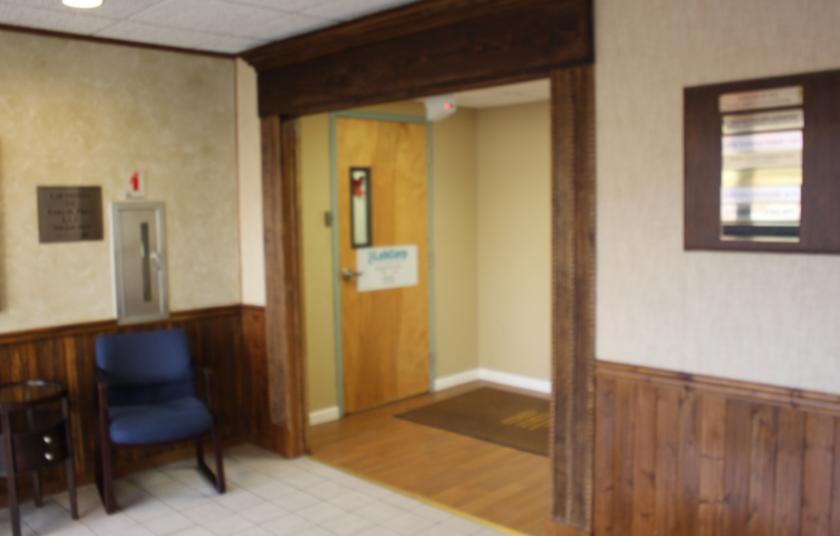
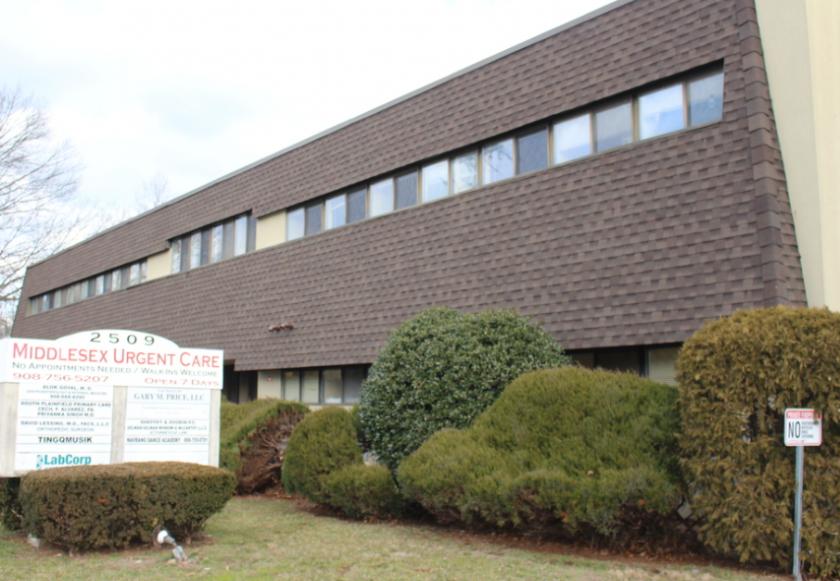
1-Mile | 3-Miles | 5-Miles | ||
---|---|---|---|---|
Total Population | 10,447 | 120,172 | 309,556 | |
Population Median Age | 42 | 38 | 39 | |
Population by Age | 0-9 Yrs | 1329 (12%) | 16576 (13%) | 39632 (12%) |
10-19 Yrs | 1040 (9%) | 14383 (11%) | 36487 (11%) | |
20-29 Yrs | 1212 (11%) | 14176 (11%) | 35531 (11%) | |
30-39 Yrs | 1068 (10%) | 17721 (14%) | 45151 (14%) | |
40-49 Yrs | 1442 (13%) | 16625 (13%) | 43491 (14%) | |
50-59 Yrs | 1624 (15%) | 16414 (13%) | 44115 (14%) | |
60-69 Yrs | 1465 (14%) | 13589 (11%) | 34862 (11%) | |
70+ Yrs | 1267 (12%) | 10688 (8%) | 30288 (9%) | |
Median HH Income | $101,334 | $87,562 | $99,972 | |
Total Household Income | < 24K | 404 (11%) | 5606 (14%) | 11710 (11%) |
25-49K | 321 (9%) | 5793 (14%) | 13839 (13%) | |
50-74K | 594 (16%) | 5995 (15%) | 14351 (13%) | |
75-99K | 415 (11%) | 4593 (11%) | 12548 (11%) | |
100-199K | 1340 (38%) | 12002 (30%) | 34592 (32%) | |
200K+ | 447 (12%) | 5416 (13%) | 17829 (17%) | |
Highest Education Level | No Diploma | 771 | 11873 | 21341 |
Diploma or GED | 1967 | 21551 | 51742 | |
Some College | 1353 | 12108 | 30480 | |
Assoc. Degree | 493 | 4288 | 12714 | |
Bachelors Degree | 1889 | 18507 | 57658 | |
Higher Degree | 1041 | 14326 | 43641 | |
Total Housing Units | 3,624 | 41,695 | 110,510 | |
--Owner-Occupied | 3,146 | 25,348 | 70,978 | |
--Renter-Occupied | 375 | 14,057 | 33,890 | |
Owner-Occupied Values | < 100K | 39 | 512 | 1498 |
100-199K | 97 | 1966 | 3995 | |
200-299K | 848 | 5852 | 14613 | |
300-399K | 1362 | 7027 | 19467 | |
400-499K | 409 | 3696 | 11845 | |
500K+ | 391 | 6296 | 19559 | |
Total Working Age Population | 8,469 | 94,886 | 247,071 | |
In Work Force | 5,577 | 64,099 | 168,414 | |
Not In Work Force | 2,893 | 30,787 | 78,657 | |
Workforce Employed | 5,238 | 59,824 | 158,814 | |
Workforce Unemployed | 339 | 4,276 | 9,587 | |
Civlian Workforce | 5,577 | 64,099 | 168,402 | |
Military Workforce | 0 | 0 | 13 | |
Total Households | 3,521 | 39,405 | 104,868 | |
Family Households | 2,770 | 30,104 | 80,101 | |
Non-Family Households | 752 | 9,302 | 24,767 | |
Married Couple | 2,257 | 21,979 | 61,547 | |
Other Family | 513 | 8,125 | 18,554 | |
Married w/Child | 906 | 10,356 | 29,004 | |
Single Male w/Child | 105 | 1,192 | 2,228 | |
Single Female w/Child | 106 | 2,325 | 4,975 |
Population Change Last Two Decades - Plus Projection
2000 | % | 2010 | % | 2020 | % | 2030 | |
---|---|---|---|---|---|---|---|
New Jersey | 8,414,350 | +4 | 8,791,894 | +4 | 9,132,700 | +4 | 9,530,900 |
Middlesex County | 750,162 | +8 | 809,858 | +8 | 873,400 | +7 | 932,200 |
Monmouth County | 615,301 | +2 | 630,380 | 0 | 633,400 | +3 | 655,300 |
Morris County | 470,212 | +5 | 492,276 | +3 | 509,100 | +5 | 535,600 |
Somerset County | 297,490 | +9 | 323,444 | +6 | 342,900 | +7 | 366,700 |
Union County | 522,541 | +3 | 536,499 | +7 | 573,000 | +6 | 605,600 |
Total Working Age Population:
Total Households:
Total Working Age Population:
Total Households:
Total Working Age Population:
Total Households: