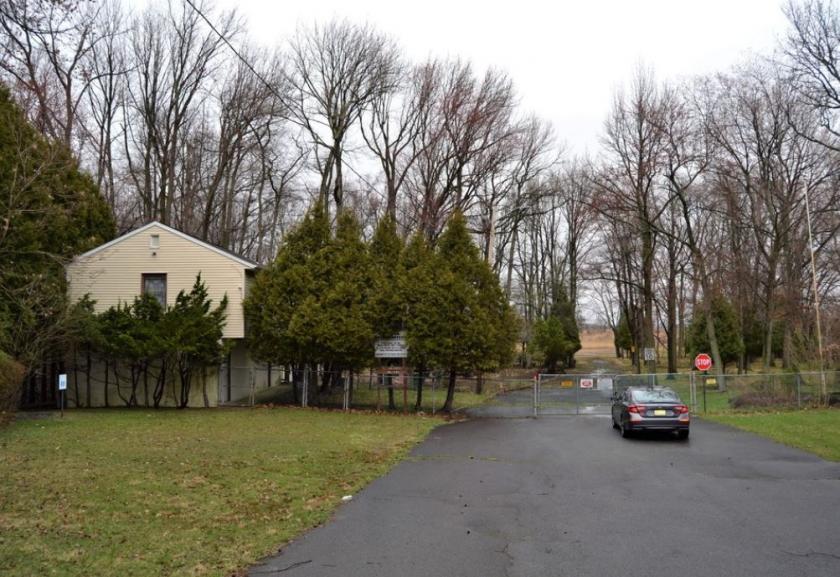
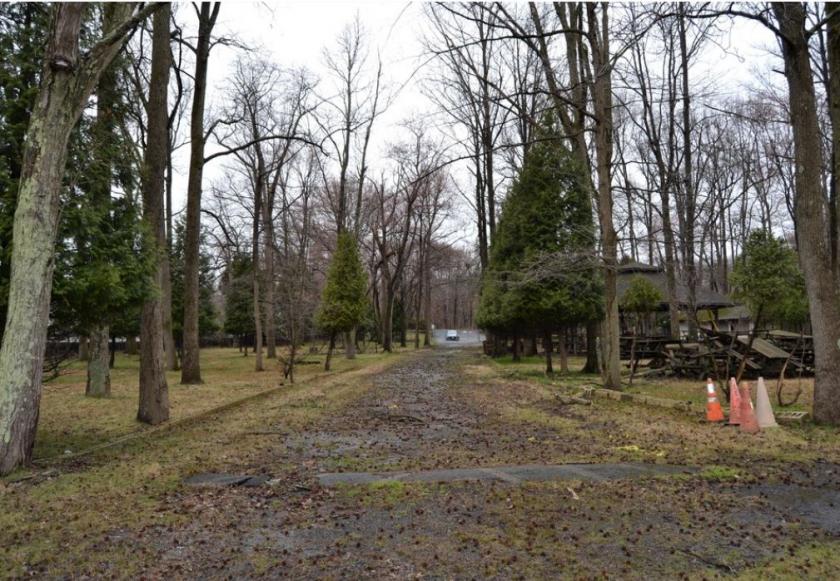
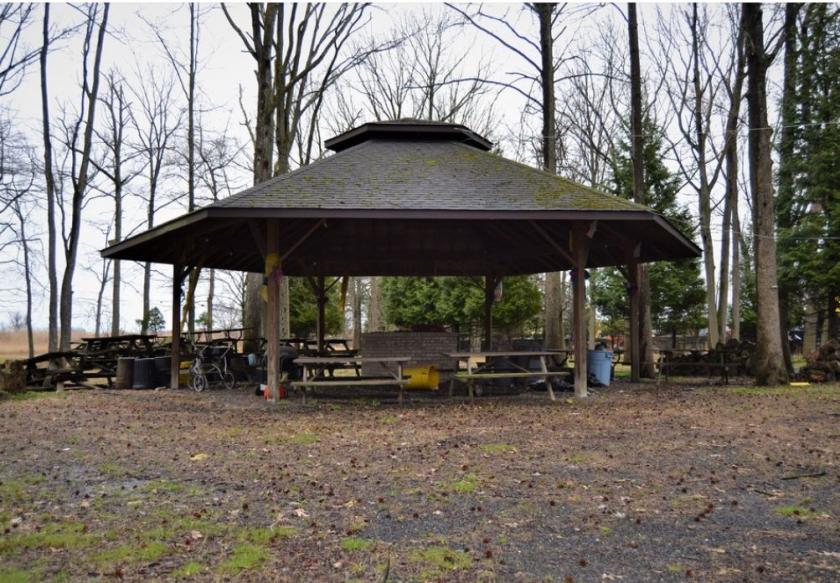
1-Mile | 3-Miles | 5-Miles | ||
---|---|---|---|---|
Total Population | 8,301 | 88,780 | 263,205 | |
Population Median Age | 39 | 38 | 37 | |
Population by Age | 0-9 Yrs | 943 (11%) | 9983 (11%) | 32241 (12%) |
10-19 Yrs | 1084 (13%) | 12429 (13%) | 36874 (14%) | |
20-29 Yrs | 893 (10%) | 12938 (14%) | 42531 (16%) | |
30-39 Yrs | 1405 (16%) | 12491 (14%) | 37462 (14%) | |
40-49 Yrs | 1215 (14%) | 10983 (12%) | 32302 (12%) | |
50-59 Yrs | 1247 (15%) | 12919 (14%) | 34447 (13%) | |
60-69 Yrs | 823 (9%) | 9566 (10%) | 26017 (9%) | |
70+ Yrs | 691 (8%) | 7472 (8%) | 21331 (8%) | |
Median HH Income | $75,358 | $86,802 | $80,897 | |
Total Household Income | < 24K | 452 (14%) | 3517 (11%) | 13496 (15%) |
25-49K | 467 (15%) | 4953 (16%) | 14373 (16%) | |
50-74K | 604 (19%) | 4489 (15%) | 13292 (15%) | |
75-99K | 517 (16%) | 4196 (14%) | 11170 (12%) | |
100-199K | 782 (25%) | 9219 (30%) | 25629 (29%) | |
200K+ | 239 (7%) | 3506 (11%) | 9634 (10%) | |
Highest Education Level | No Diploma | 801 | 5216 | 21572 |
Diploma or GED | 1908 | 16138 | 42668 | |
Some College | 944 | 10338 | 26078 | |
Assoc. Degree | 380 | 4395 | 11650 | |
Bachelors Degree | 1334 | 15002 | 41761 | |
Higher Degree | 502 | 8264 | 26710 | |
Total Housing Units | 3,561 | 31,549 | 92,936 | |
--Owner-Occupied | 2,042 | 19,361 | 50,027 | |
--Renter-Occupied | 1,020 | 10,518 | 37,567 | |
Owner-Occupied Values | < 100K | 81 | 500 | 1494 |
100-199K | 305 | 1678 | 3990 | |
200-299K | 855 | 5306 | 14299 | |
300-399K | 519 | 6288 | 15764 | |
400-499K | 213 | 3415 | 8613 | |
500K+ | 69 | 2175 | 5866 | |
Total Working Age Population | 6,678 | 72,296 | 211,592 | |
In Work Force | 4,702 | 47,458 | 136,854 | |
Not In Work Force | 1,977 | 24,838 | 74,738 | |
Workforce Employed | 4,244 | 44,275 | 128,660 | |
Workforce Unemployed | 458 | 3,184 | 8,140 | |
Civlian Workforce | 4,702 | 47,458 | 136,800 | |
Military Workforce | 0 | 0 | 54 | |
Total Households | 3,062 | 29,880 | 87,594 | |
Family Households | 2,183 | 21,935 | 61,846 | |
Non-Family Households | 879 | 7,945 | 25,747 | |
Married Couple | 1,663 | 16,871 | 45,910 | |
Other Family | 520 | 5,064 | 15,936 | |
Married w/Child | 844 | 7,572 | 21,129 | |
Single Male w/Child | 30 | 632 | 1,986 | |
Single Female w/Child | 143 | 1,536 | 5,351 |
Population Change Last Two Decades - Plus Projection
2000 | % | 2010 | % | 2020 | % | 2030 | |
---|---|---|---|---|---|---|---|
New Jersey | 8,414,350 | +4 | 8,791,894 | +4 | 9,132,700 | +4 | 9,530,900 |
Middlesex County | 750,162 | +8 | 809,858 | +8 | 873,400 | +7 | 932,200 |
Monmouth County | 615,301 | +2 | 630,380 | 0 | 633,400 | +3 | 655,300 |
Somerset County | 297,490 | +9 | 323,444 | +6 | 342,900 | +7 | 366,700 |
Total Working Age Population:
Total Households:
Total Working Age Population:
Total Households:
Total Working Age Population:
Total Households: