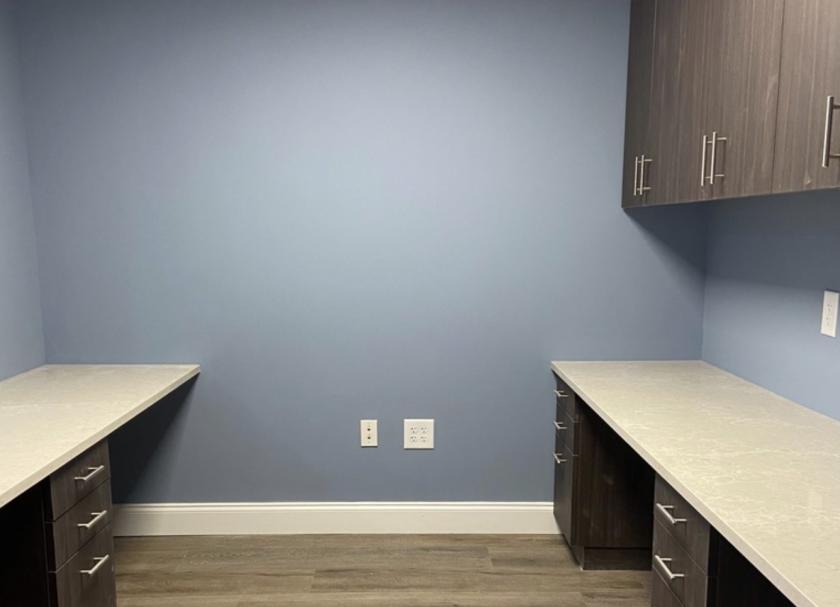
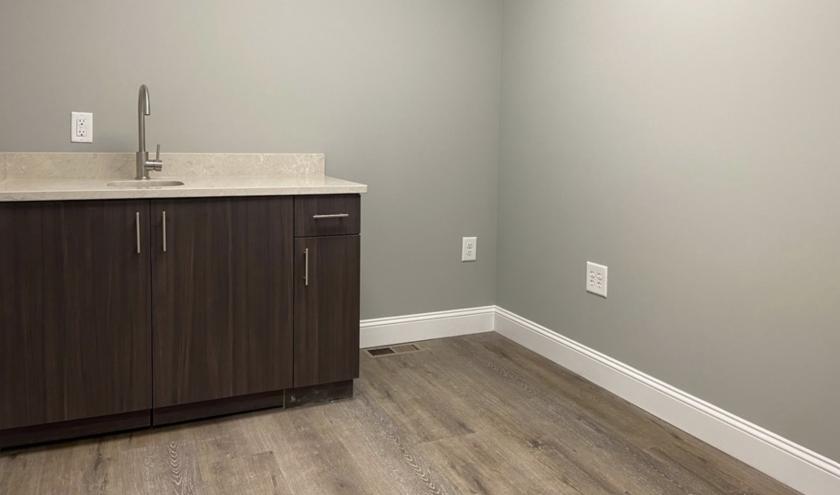
Office Space
1137 Alpharetta Street Roswell, GA 30075
1137 Alpharetta Street Roswell, GA 30075
Details & Description
Property Highlights
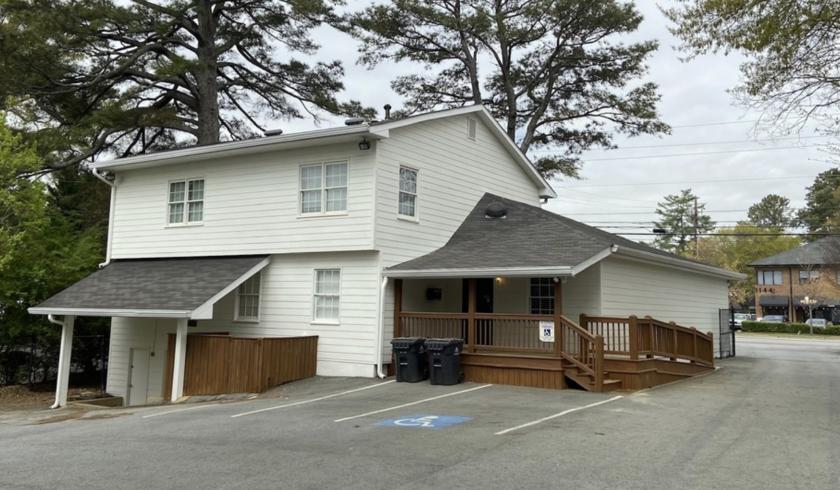
- • Easy access to Roswell Square, GA400.
- • Secured parking.
- • Surrounded by dining, banking and shopping.
- • Signage opportunity on Roswell Rd.
Listing Agents

Rocky Kaufmann
KW Commercial
O: 770-992-3356
M: 678-576-1485
rockyk@kw.com
KW Commercial
O: 770-992-3356
M: 678-576-1485
rockyk@kw.com
While we strive to provide the most accurate information, all listing information, and demographic data, is provided by third-parties. As such, MyEListing will not be responsible for the accuracy of the information. It is strongly recommended that you verify all information with the listing agent, and any relevant agencies, prior to making any decisions.