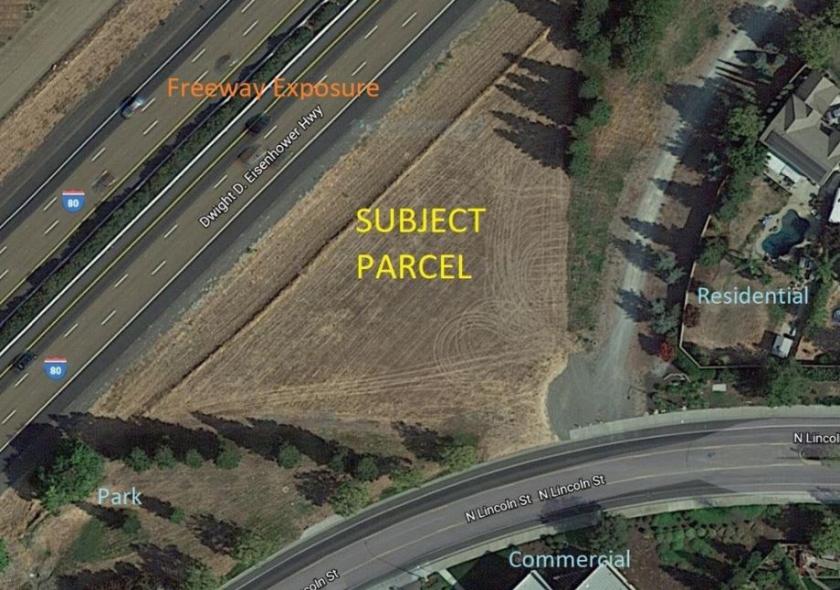
Commercial Land
East of I-80 at North Lincoln Street and Vaughn Road Dixon, CA 95620
East of I-80 at North Lincoln Street and Vaughn Road Dixon, CA 95620
Details & Description
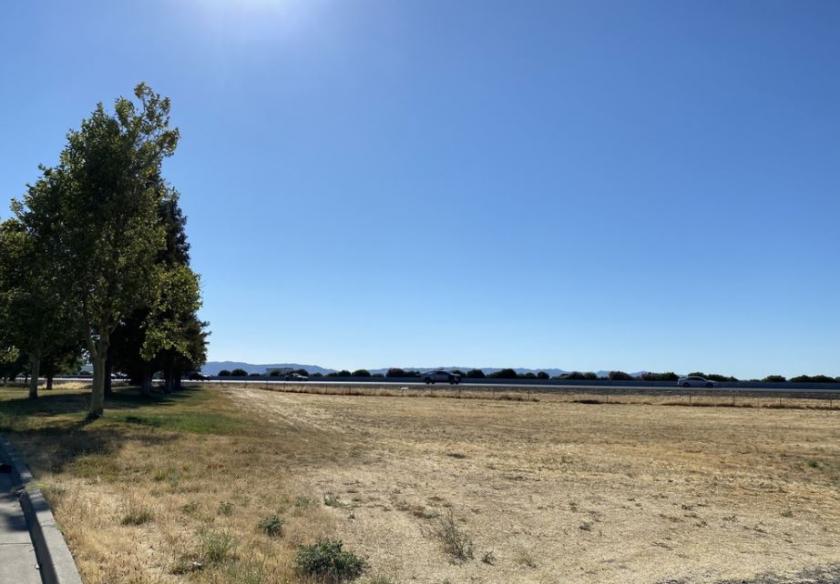
Additional Photos


Listing Agents

Kathleen Kragen
KW Commercial
O: 925-448-4508
kkragen@kw.com
KW Commercial
O: 925-448-4508
kkragen@kw.com
While we strive to provide the most accurate information, all listing information, and demographic data, is provided by third-parties. As such, MyEListing will not be responsible for the accuracy of the information. It is strongly recommended that you verify all information with the listing agent, and any relevant agencies, prior to making any decisions.


