Commercial Land
9646 Old Steubenville Pike Bulger, PA 15019
9646 Old Steubenville Pike Bulger, PA 15019
Details & Description
Property Highlights
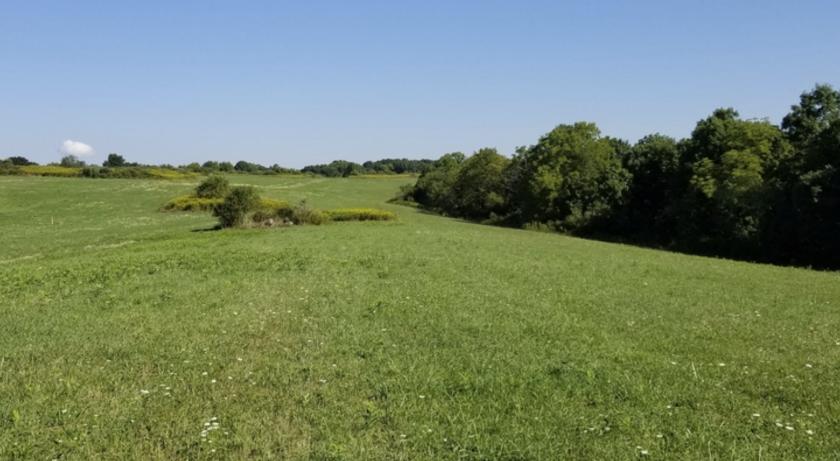
• Approximately 1,000 feet of frontage along Old Steubenville Pike for the commercially zoned property.
• Property located directly off the Bavington exit on Rt. 22
Listing Agents

Richard Kasowski
KW Commercial
O: 724-933-8550
M: 412-302-5427
rkasowski@kw.com
KW Commercial
O: 724-933-8550
M: 412-302-5427
rkasowski@kw.com
While we strive to provide the most accurate information, all listing information, and demographic data, is provided by third-parties. As such, MyEListing will not be responsible for the accuracy of the information. It is strongly recommended that you verify all information with the listing agent, and any relevant agencies, prior to making any decisions.


