Office Space
830 South Northwest Highway Barrington, IL 60010
830 South Northwest Highway Barrington, IL 60010

Details & Description
Property Highlights
- • Income producing office building
- • 90 Occupancy
- • Taxes $13,414 paid in 2020 for 2019
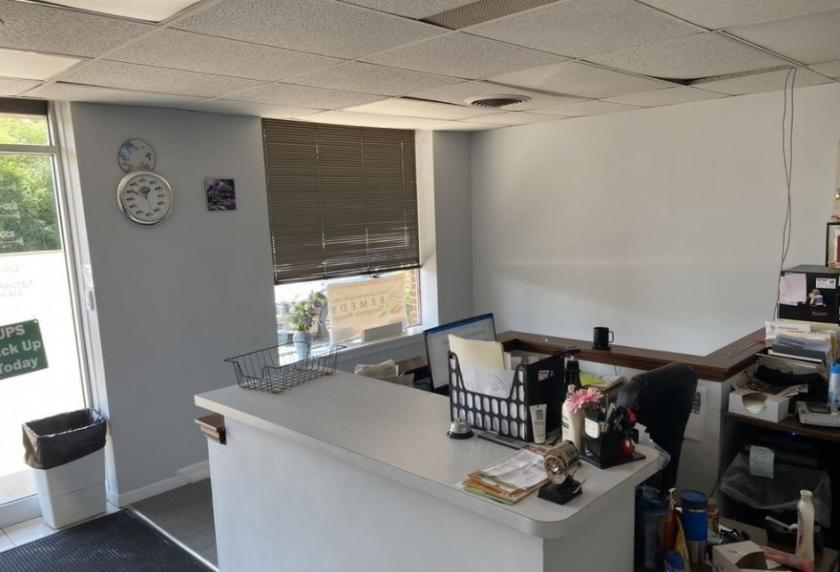
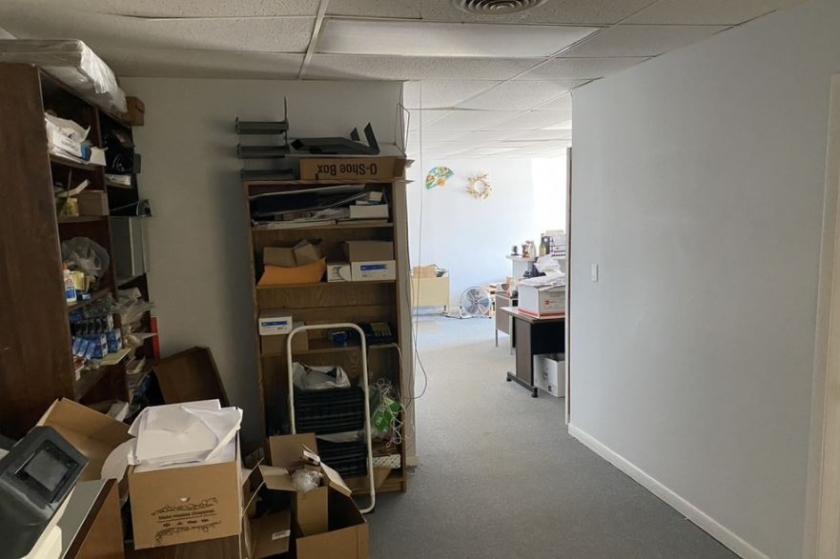
Additional Photos

Listing Agents

Joseph Heffernan
KW Commercial
O: 847-302-5550
M: 847-302-5550
joeh@kwcommercial.com
KW Commercial
O: 847-302-5550
M: 847-302-5550
joeh@kwcommercial.com
While we strive to provide the most accurate information, all listing information, and demographic data, is provided by third-parties. As such, MyEListing will not be responsible for the accuracy of the information. It is strongly recommended that you verify all information with the listing agent, and any relevant agencies, prior to making any decisions.


