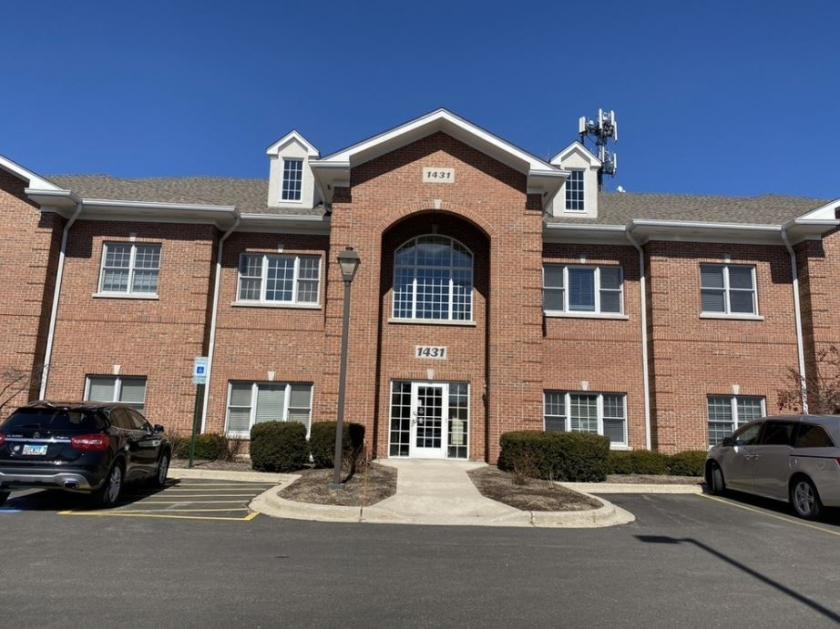
Office Space
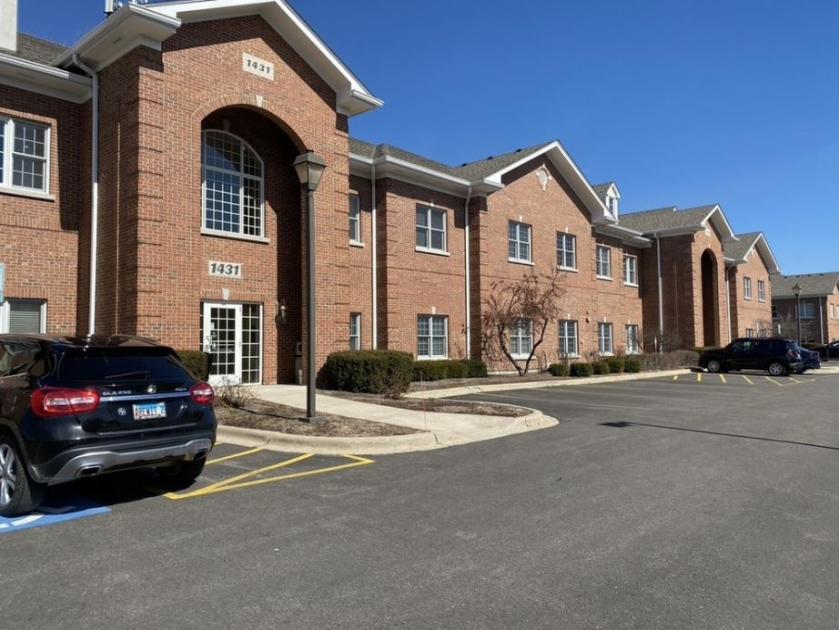
1431 McHenry Road Buffalo Grove, IL 60089
1431 McHenry Road Buffalo Grove, IL 60089
Details & Description
Property Highlights
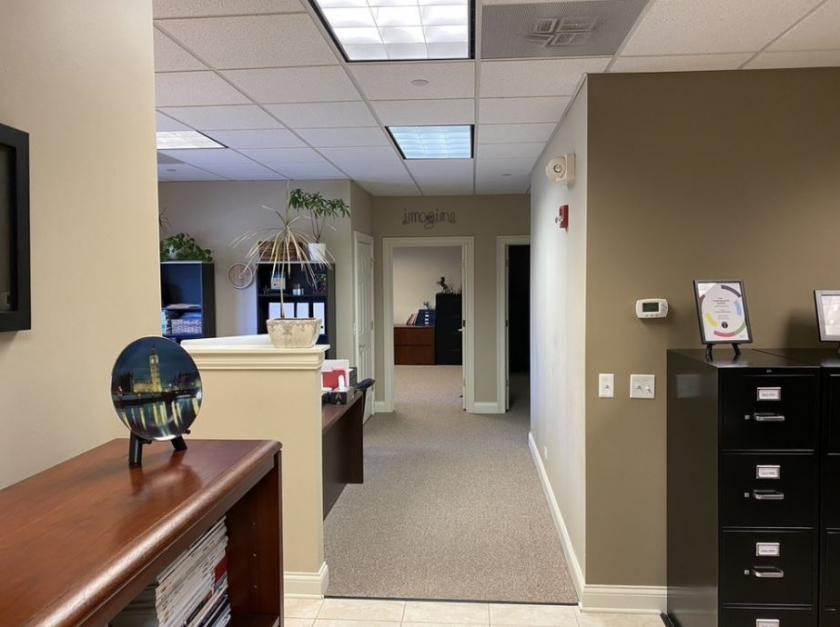
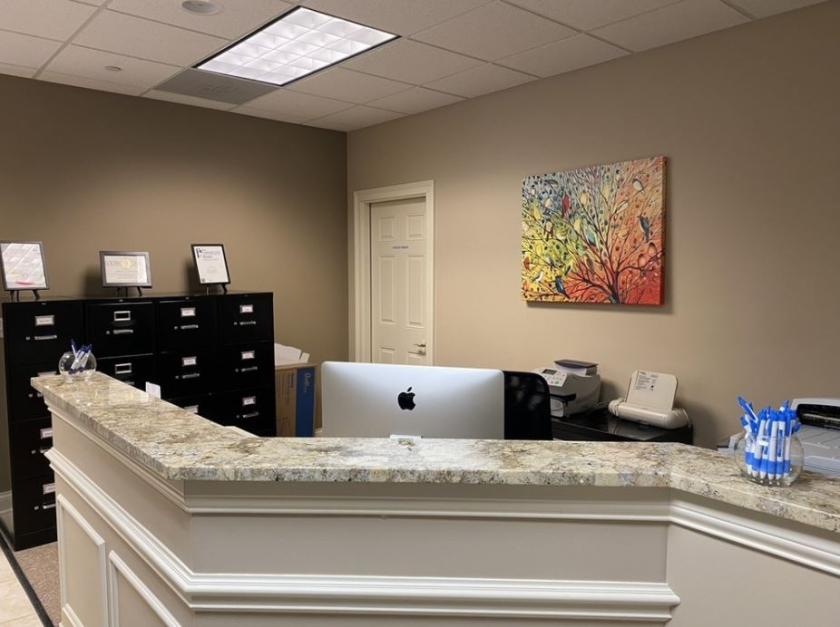
- • Reception Area, Coffee BarSink, StorageCopier Room
- • 2 Office Areas
- • Conference Room
- • Additional Basement Storage-Elevator Access
- • Lease $19sf Modified Gross tax stop current year
Additional Photos
Listing Agents

Joseph Heffernan
KW Commercial
O: 847-302-5550
M: 847-302-5550
joeh@kwcommercial.com
KW Commercial
O: 847-302-5550
M: 847-302-5550
joeh@kwcommercial.com
While we strive to provide the most accurate information, all listing information, and demographic data, is provided by third-parties. As such, MyEListing will not be responsible for the accuracy of the information. It is strongly recommended that you verify all information with the listing agent, and any relevant agencies, prior to making any decisions.


