Specialty Real Estate
1329 Freeport Road Natrona Heights, PA 15065
1329 Freeport Road Natrona Heights, PA 15065
Details & Description
Property Highlights
- • 3 floors of 10,000 sq. ft each
- • Parking for 35 cars
- • Soda Fountain area
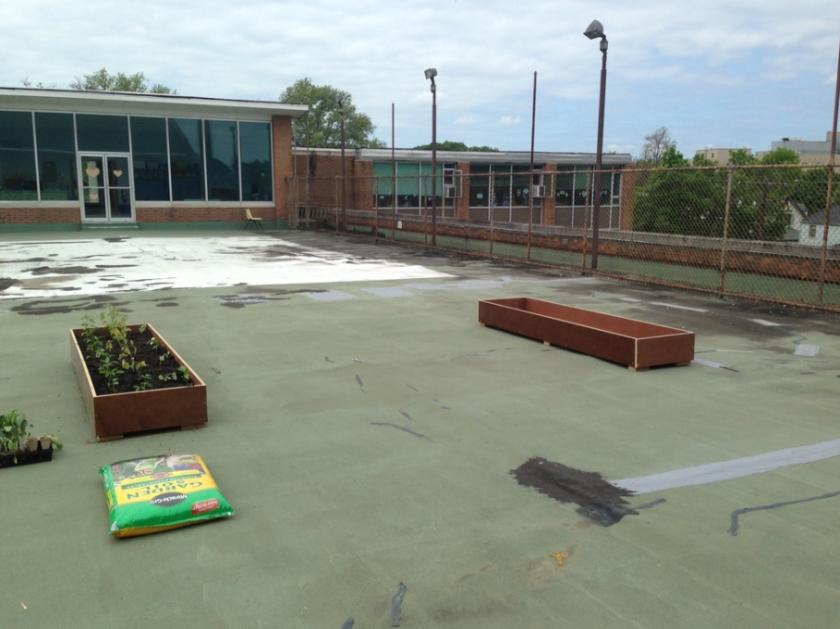
- • Rooftop deck with expansive views
- • Large open foyer with 2 staircases
- • Superb location close to PA 28 and I-76
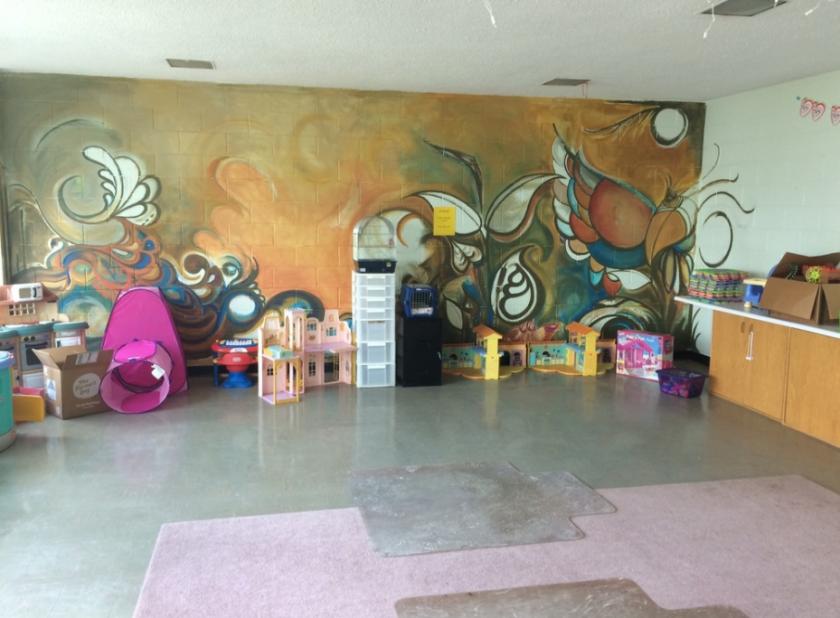
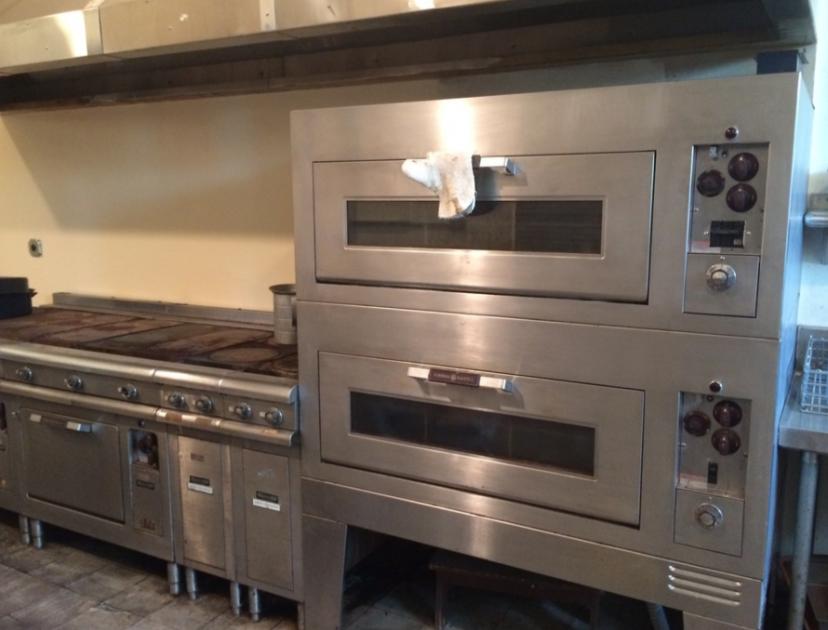
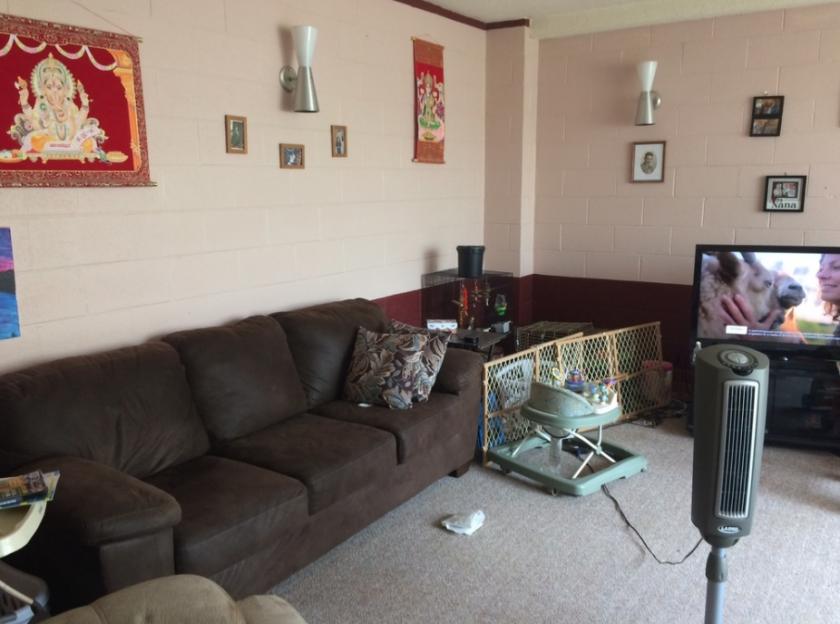
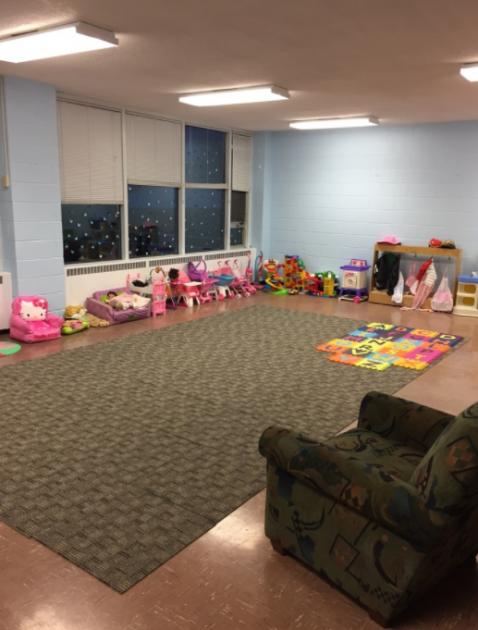
Additional Photos
Listing Agents

Bill Forde
KW Commercial
O: 412-854-4000
M: 412-439-0429
bforde@kwcommercial.com
KW Commercial
O: 412-854-4000
M: 412-439-0429
bforde@kwcommercial.com
While we strive to provide the most accurate information, all listing information, and demographic data, is provided by third-parties. As such, MyEListing will not be responsible for the accuracy of the information. It is strongly recommended that you verify all information with the listing agent, and any relevant agencies, prior to making any decisions.


