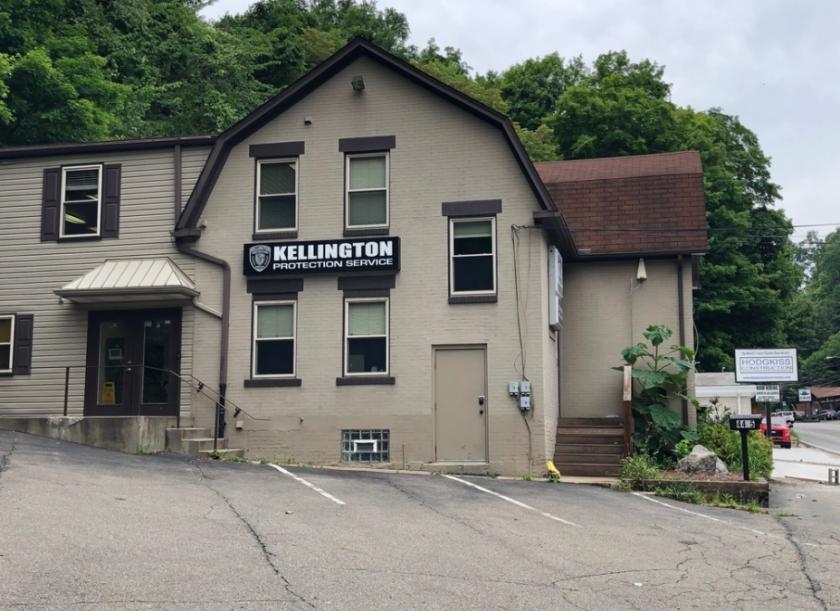
Office Space
4405 Steubenville Pike Pittsburgh, PA 15205
4405 Steubenville Pike Pittsburgh, PA 15205
Details & Description
Property Highlights
- • Purchase for $340,000 or Lease for $3,000mo. NNN
- • 13,000 ADT
- • On site parking for 14 cars
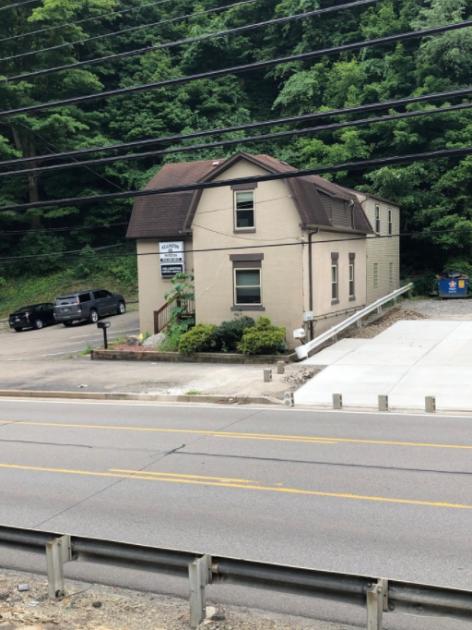
- • Convenient location near I-376 I-79
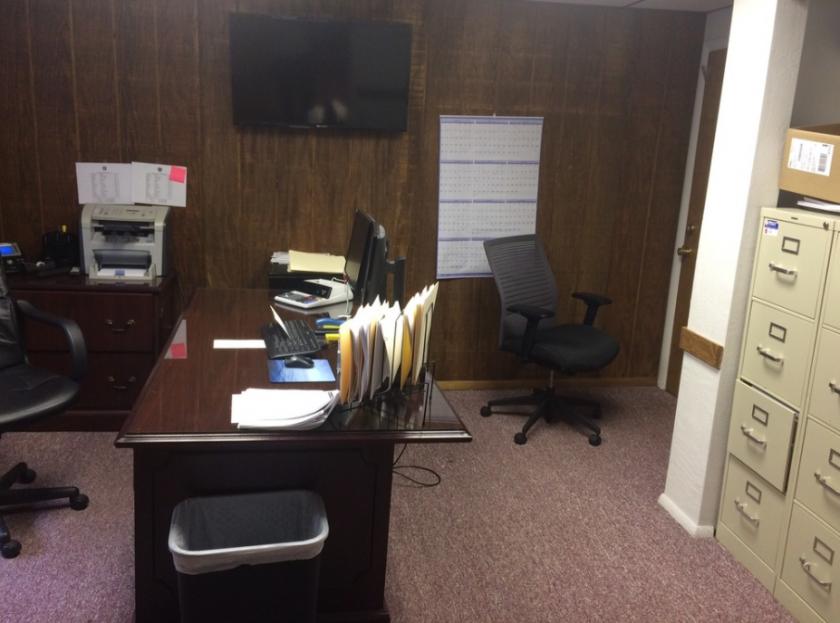
Additional Photos


Listing Agents

Bill Forde
KW Commercial
O: 412-854-4000
M: 412-439-0429
bforde@kwcommercial.com
KW Commercial
O: 412-854-4000
M: 412-439-0429
bforde@kwcommercial.com
While we strive to provide the most accurate information, all listing information, and demographic data, is provided by third-parties. As such, MyEListing will not be responsible for the accuracy of the information. It is strongly recommended that you verify all information with the listing agent, and any relevant agencies, prior to making any decisions.


