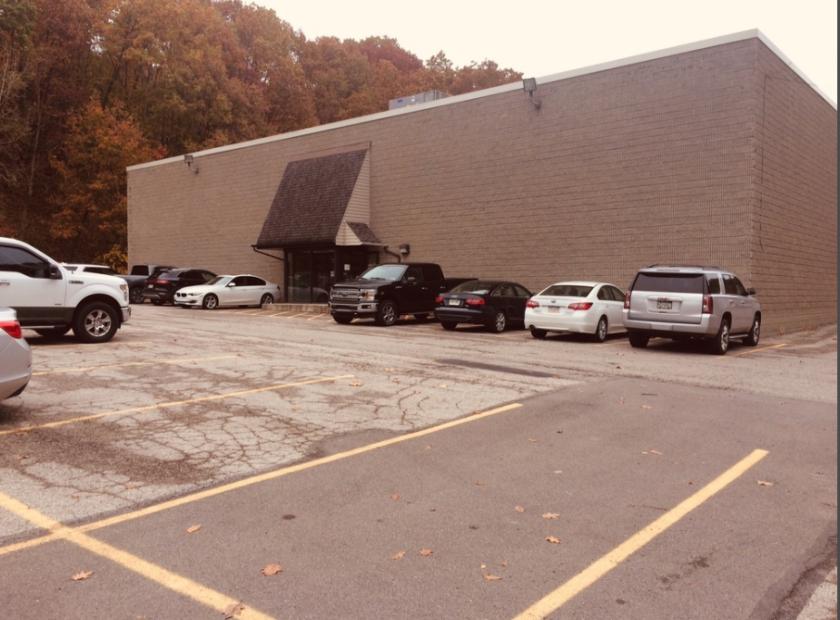
Specialty Real Estate
1341 McLaughlin Run Road Pittsburgh, PA 15241
1341 McLaughlin Run Road Pittsburgh, PA 15241

Details & Description
Property Highlights
- • Partial 2nd floor with walk around balcony
- • Easy access to Rt 19 and I-79
- • Climate controlled facility
- • New roof and HVAC units
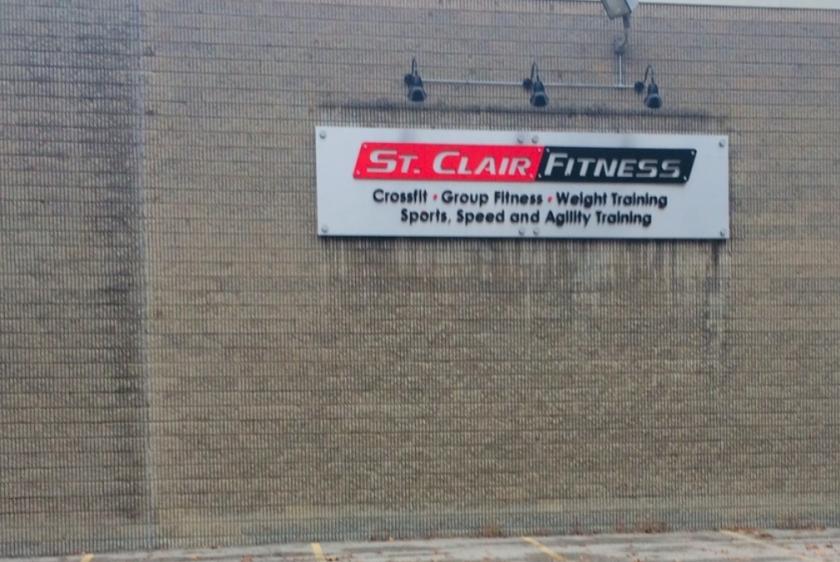
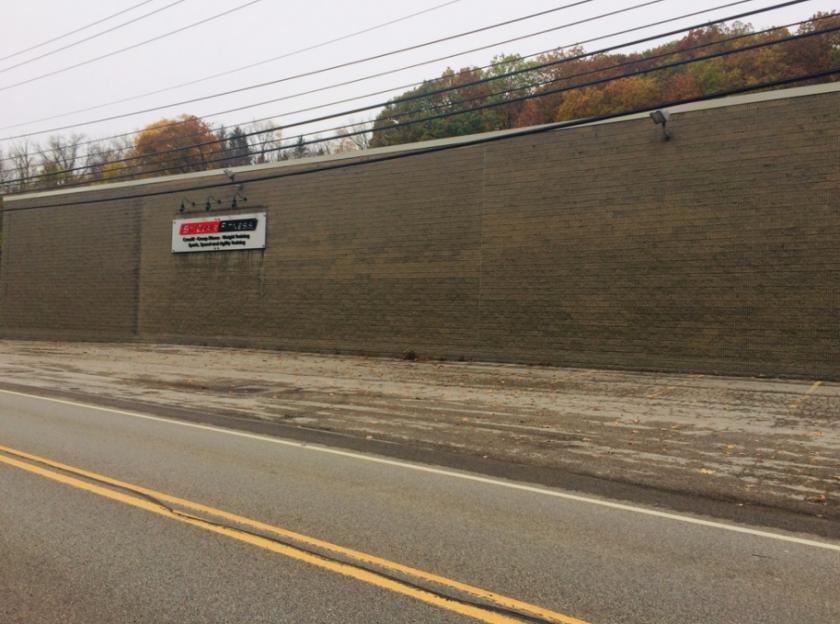
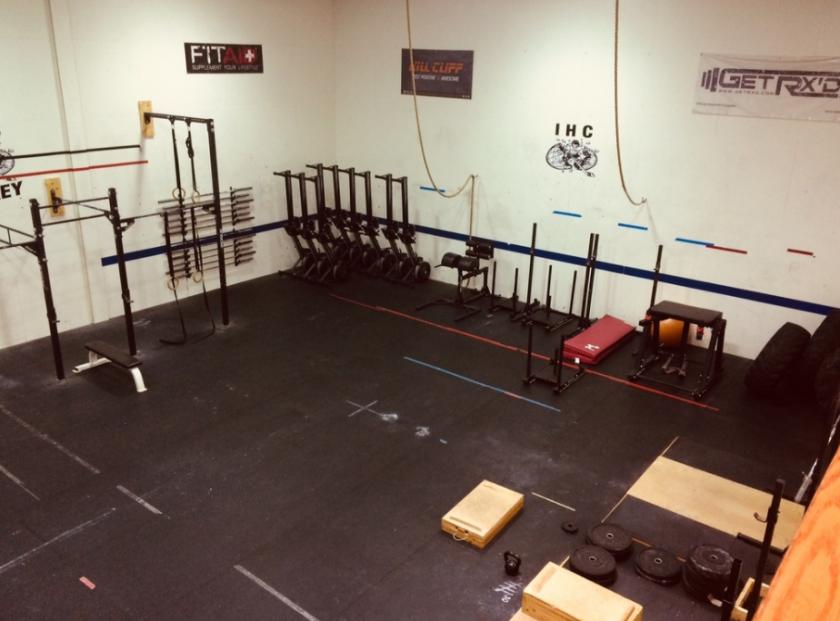
Additional Photos
Listing Agents

Bill Forde
KW Commercial
O: 412-854-4000
M: 412-439-0429
bforde@kwcommercial.com
KW Commercial
O: 412-854-4000
M: 412-439-0429
bforde@kwcommercial.com
While we strive to provide the most accurate information, all listing information, and demographic data, is provided by third-parties. As such, MyEListing will not be responsible for the accuracy of the information. It is strongly recommended that you verify all information with the listing agent, and any relevant agencies, prior to making any decisions.


