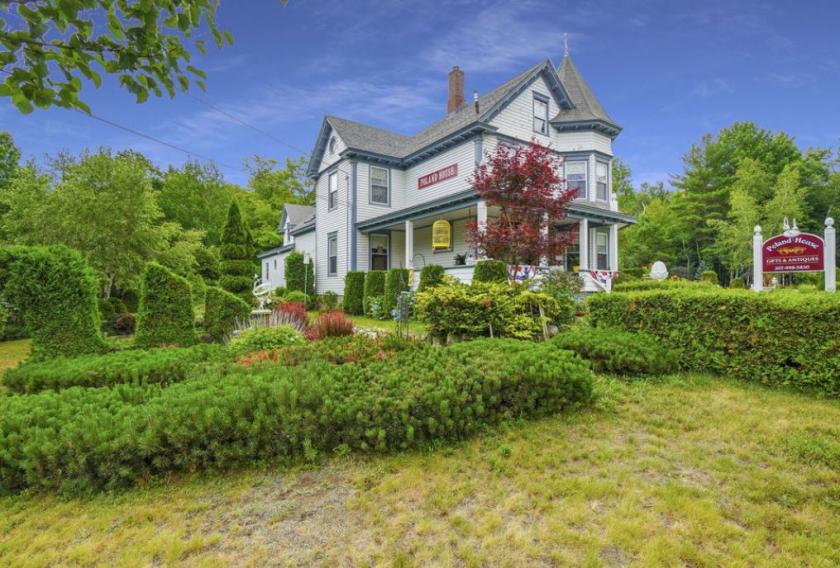
1-Mile | 3-Miles | 5-Miles | ||
---|---|---|---|---|
Total Population | 383 | 3,031 | 9,722 | |
Population Median Age | 39 | 40 | 41 | |
Population by Age | 0-9 Yrs | 67 (17%) | 503 (16%) | 1400 (14%) |
10-19 Yrs | 34 (8%) | 249 (8%) | 894 (9%) | |
20-29 Yrs | 37 (9%) | 283 (9%) | 787 (8%) | |
30-39 Yrs | 55 (14%) | 437 (14%) | 1395 (14%) | |
40-49 Yrs | 37 (9%) | 299 (9%) | 1217 (12%) | |
50-59 Yrs | 71 (18%) | 556 (18%) | 1855 (19%) | |
60-69 Yrs | 53 (13%) | 413 (13%) | 1323 (13%) | |
70+ Yrs | 29 (7%) | 291 (9%) | 851 (8%) | |
Median HH Income | $81,632 | $75,787 | $75,340 | |
Total Household Income | < 24K | 11 (7%) | 107 (9%) | 371 (9%) |
25-49K | 17 (12%) | 155 (13%) | 677 (17%) | |
50-74K | 34 (24%) | 304 (26%) | 866 (22%) | |
75-99K | 29 (20%) | 187 (16%) | 656 (17%) | |
100-199K | 38 (27%) | 329 (28%) | 1056 (27%) | |
200K+ | 11 (7%) | 62 (5%) | 221 (5%) | |
Highest Education Level | No Diploma | 21 | 136 | 392 |
Diploma or GED | 89 | 703 | 2345 | |
Some College | 71 | 574 | 1552 | |
Assoc. Degree | 23 | 199 | 724 | |
Bachelors Degree | 42 | 374 | 1425 | |
Higher Degree | 27 | 183 | 673 | |
Total Housing Units | 162 | 1,353 | 4,576 | |
--Owner-Occupied | 126 | 984 | 3,308 | |
--Renter-Occupied | 14 | 159 | 539 | |
Owner-Occupied Values | < 100K | 29 | 208 | 527 |
100-199K | 44 | 296 | 982 | |
200-299K | 37 | 342 | 1176 | |
300-399K | 11 | 109 | 411 | |
400-499K | 0 | 3 | 69 | |
500K+ | 5 | 27 | 142 | |
Total Working Age Population | 303 | 2,424 | 7,829 | |
In Work Force | 207 | 1,655 | 5,597 | |
Not In Work Force | 95 | 769 | 2,232 | |
Workforce Employed | 193 | 1,575 | 5,403 | |
Workforce Unemployed | 14 | 80 | 194 | |
Civlian Workforce | 207 | 1,655 | 5,597 | |
Military Workforce | 0 | 0 | 0 | |
Total Households | 140 | 1,143 | 3,847 | |
Family Households | 108 | 855 | 2,769 | |
Non-Family Households | 32 | 288 | 1,078 | |
Married Couple | 86 | 680 | 2,346 | |
Other Family | 23 | 175 | 423 | |
Married w/Child | 38 | 257 | 880 | |
Single Male w/Child | 9 | 40 | 97 | |
Single Female w/Child | 3 | 73 | 174 |
Population Change Last Two Decades - Plus Projection
2000 | % | 2010 | % | 2020 | % | 2030 | |
---|---|---|---|---|---|---|---|
Maine | 1,274,923 | +4 | 1,328,361 | +1 | 1,335,260 | 0 | 1,341,046 |
Androscoggin County | 103,793 | +4 | 107,702 | 0 | 107,968 | +1 | 108,769 |
Cumberland County | 265,612 | +6 | 281,674 | +5 | 294,711 | +2 | 301,376 |
Oxford County | 54,755 | +6 | 57,833 | -3 | 56,108 | -3 | 54,294 |
Total Working Age Population:
Total Households:
Total Working Age Population:
Total Households:
Total Working Age Population:
Total Households: