Industrial Properties
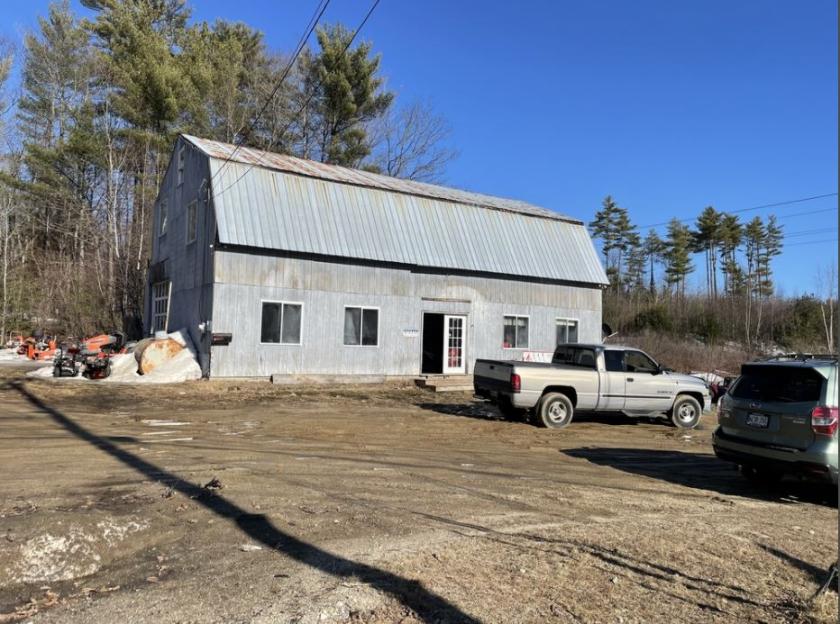
96 Portland Road Bridgton, ME 04009
96 Portland Road Bridgton, ME 04009
Details & Description
Property Highlights
- • High traffic location
- • Large working service bay
- • Retail space
- • Installed apartment in process
- • Dug well
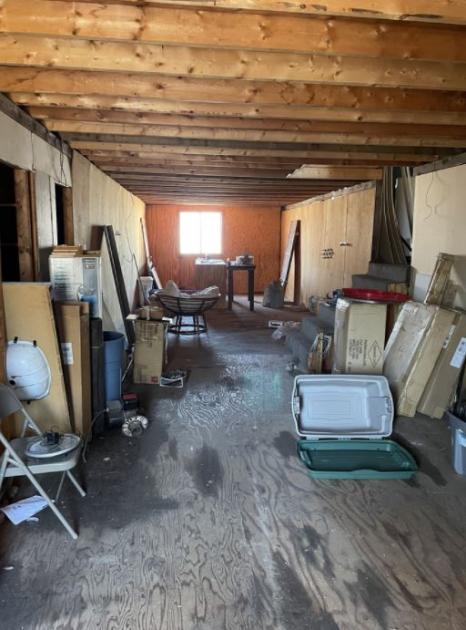
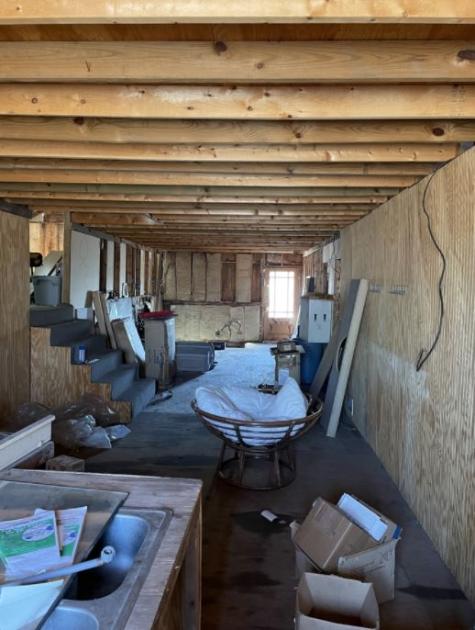
Additional Photos

Listing Agents

Nicholas Herold
O: 207-879-9800
nherold@kw.com
O: 207-879-9800
nherold@kw.com
While we strive to provide the most accurate information, all listing information, and demographic data, is provided by third-parties. As such, MyEListing will not be responsible for the accuracy of the information. It is strongly recommended that you verify all information with the listing agent, and any relevant agencies, prior to making any decisions.


