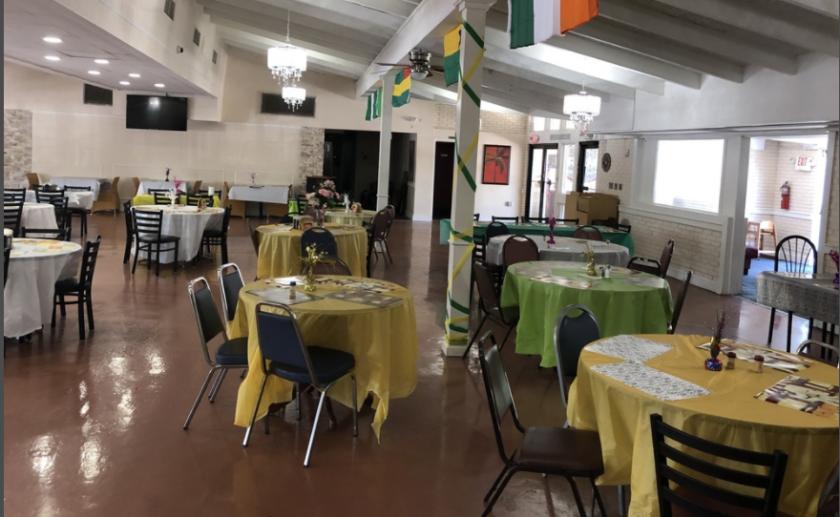
Retail Space
7643 Georgia 85 Riverdale, GA 30274
7643 Georgia 85 Riverdale, GA 30274
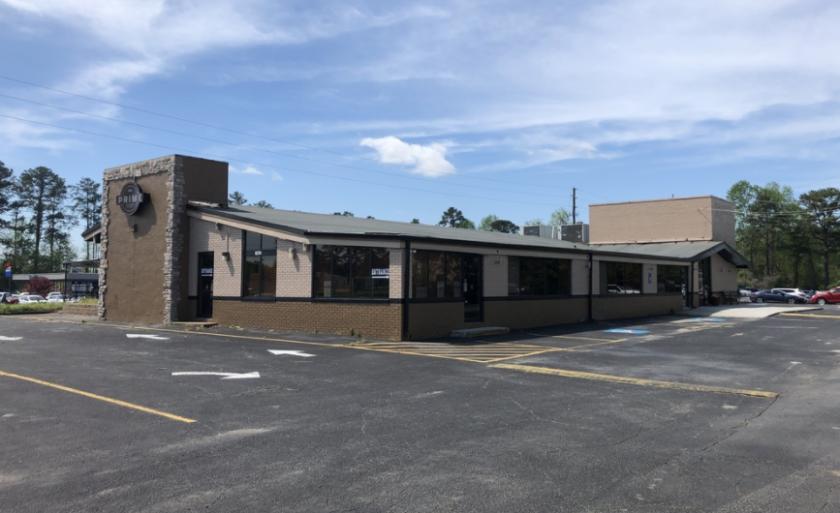
Details & Description
Property Highlights
- • Recently Renovated
- • Hwy 85 Riverdale
- • High Traffic count
- • Former Ryans Restaurant For Sale
- • Great visibility
Listing Agents

Patrick Hallwood
KW Commercial
O: 404-663-7291
M: 404-242-6500
patrickhallwood@kw.com
KW Commercial
O: 404-663-7291
M: 404-242-6500
patrickhallwood@kw.com
While we strive to provide the most accurate information, all listing information, and demographic data, is provided by third-parties. As such, MyEListing will not be responsible for the accuracy of the information. It is strongly recommended that you verify all information with the listing agent, and any relevant agencies, prior to making any decisions.