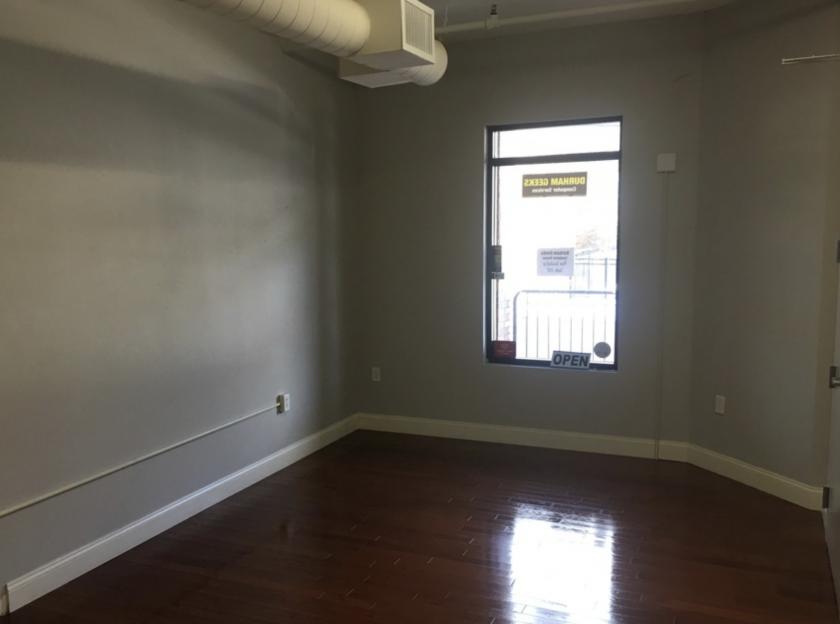
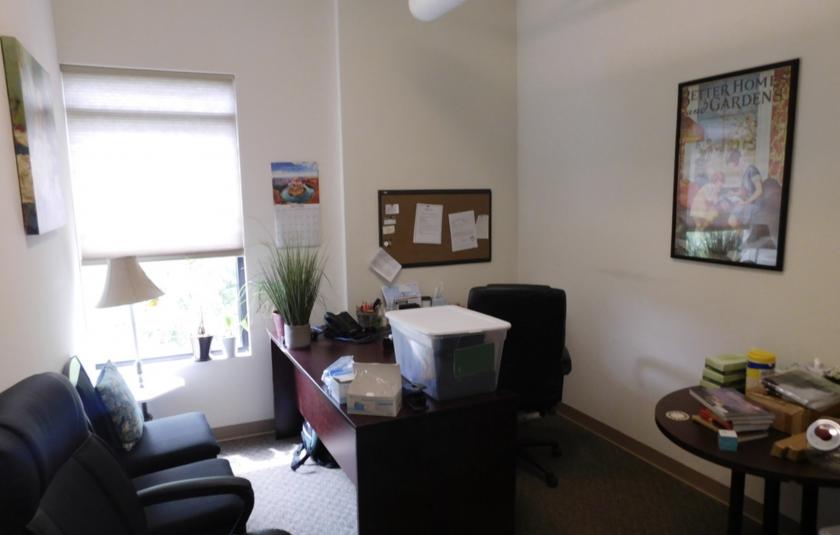
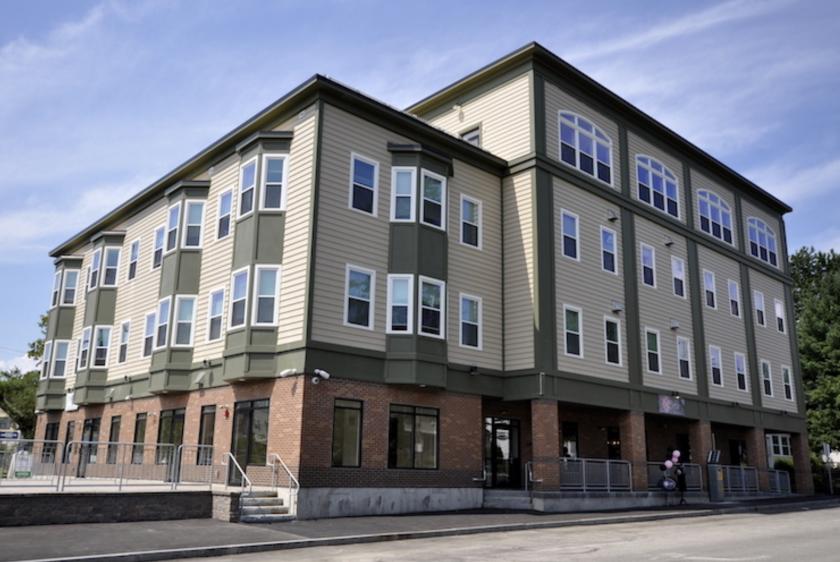
1-Mile | 3-Miles | 5-Miles | ||
---|---|---|---|---|
Total Population | 5,226 | 19,741 | 47,252 | |
Population Median Age | 28 | 30 | 36 | |
Population by Age | 0-9 Yrs | 259 (4%) | 1092 (5%) | 4071 (8%) |
10-19 Yrs | 1671 (31%) | 5987 (30%) | 8258 (17%) | |
20-29 Yrs | 1975 (37%) | 6766 (34%) | 11861 (25%) | |
30-39 Yrs | 212 (4%) | 930 (4%) | 4462 (9%) | |
40-49 Yrs | 287 (5%) | 1234 (6%) | 4308 (9%) | |
50-59 Yrs | 302 (5%) | 1462 (7%) | 5650 (11%) | |
60-69 Yrs | 231 (4%) | 1159 (5%) | 4637 (9%) | |
70+ Yrs | 290 (5%) | 1111 (5%) | 4005 (8%) | |
Median HH Income | $64,144 | $80,019 | $80,319 | |
Total Household Income | < 24K | 332 (29%) | 885 (19%) | 2376 (14%) |
25-49K | 171 (15%) | 814 (17%) | 2965 (17%) | |
50-74K | 128 (11%) | 468 (10%) | 2368 (14%) | |
75-99K | 96 (8%) | 526 (11%) | 2490 (15%) | |
100-199K | 254 (22%) | 1257 (27%) | 4598 (27%) | |
200K+ | 148 (13%) | 595 (13%) | 1681 (10%) | |
Highest Education Level | No Diploma | 38 | 227 | 1408 |
Diploma or GED | 83 | 689 | 4501 | |
Some College | 175 | 913 | 4227 | |
Assoc. Degree | 86 | 483 | 2169 | |
Bachelors Degree | 465 | 2091 | 7690 | |
Higher Degree | 583 | 2106 | 5976 | |
Total Housing Units | 1,341 | 5,202 | 17,771 | |
--Owner-Occupied | 573 | 2,596 | 9,715 | |
--Renter-Occupied | 556 | 1,949 | 6,762 | |
Owner-Occupied Values | < 100K | 7 | 131 | 530 |
100-199K | 53 | 211 | 1146 | |
200-299K | 108 | 659 | 3089 | |
300-399K | 218 | 728 | 2450 | |
400-499K | 128 | 506 | 1392 | |
500K+ | 60 | 361 | 1108 | |
Total Working Age Population | 4,822 | 17,938 | 40,779 | |
In Work Force | 3,144 | 12,076 | 28,595 | |
Not In Work Force | 1,678 | 5,862 | 12,185 | |
Workforce Employed | 2,981 | 11,444 | 27,539 | |
Workforce Unemployed | 153 | 614 | 1,010 | |
Civlian Workforce | 3,134 | 12,059 | 28,548 | |
Military Workforce | 10 | 17 | 47 | |
Total Households | 1,129 | 4,545 | 16,477 | |
Family Households | 518 | 2,499 | 9,391 | |
Non-Family Households | 611 | 2,046 | 7,086 | |
Married Couple | 431 | 2,096 | 7,498 | |
Other Family | 86 | 403 | 1,893 | |
Married w/Child | 161 | 862 | 2,694 | |
Single Male w/Child | 19 | 78 | 355 | |
Single Female w/Child | 24 | 141 | 643 |
Population Change Last Two Decades - Plus Projection
2000 | % | 2010 | % | 2020 | % | 2030 | |
---|---|---|---|---|---|---|---|
Maine | 1,274,923 | +4 | 1,328,361 | +1 | 1,335,260 | 0 | 1,341,046 |
York County | 186,742 | +6 | 197,131 | +6 | 208,062 | +5 | 217,689 |
New Hampshire | 1,235,786 | +7 | 1,316,470 | +3 | 1,349,908 | +4 | 1,402,878 |
Rockingham County | 277,359 | +6 | 295,223 | +4 | 307,013 | +5 | 321,441 |
Strafford County | 112,233 | +10 | 123,143 | +5 | 128,801 | +6 | 136,472 |
Total Working Age Population:
Total Households:
Total Working Age Population:
Total Households:
Total Working Age Population:
Total Households: