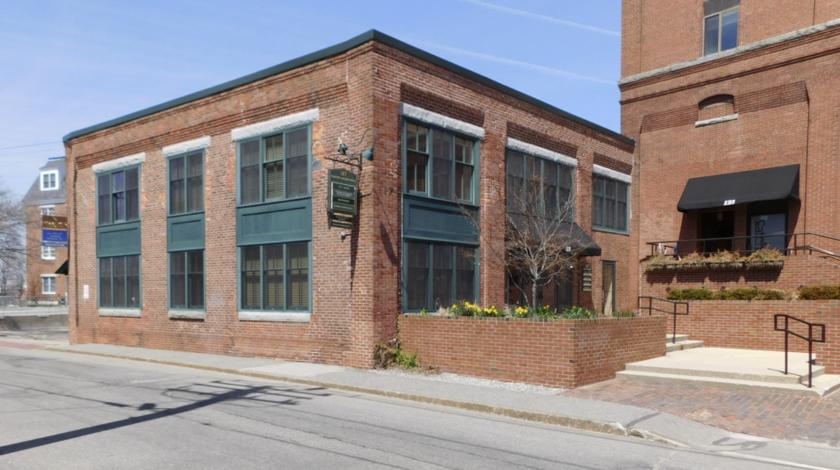
1-Mile | 3-Miles | 5-Miles | ||
---|---|---|---|---|
Total Population | 10,582 | 34,834 | 51,838 | |
Population Median Age | 43 | 43 | 44 | |
Population by Age | 0-9 Yrs | 485 (4%) | 2873 (8%) | 4356 (8%) |
10-19 Yrs | 722 (6%) | 2788 (8%) | 4099 (7%) | |
20-29 Yrs | 2216 (20%) | 5317 (15%) | 6907 (13%) | |
30-39 Yrs | 1976 (18%) | 5110 (14%) | 7049 (13%) | |
40-49 Yrs | 1023 (9%) | 3938 (11%) | 5962 (11%) | |
50-59 Yrs | 1229 (11%) | 4728 (13%) | 8161 (15%) | |
60-69 Yrs | 1663 (15%) | 5294 (15%) | 7951 (15%) | |
70+ Yrs | 1269 (11%) | 4786 (13%) | 7352 (14%) | |
Median HH Income | $85,714 | $84,883 | $88,066 | |
Total Household Income | < 24K | 707 (12%) | 2133 (13%) | 3003 (12%) |
25-49K | 746 (13%) | 2467 (15%) | 3358 (14%) | |
50-74K | 1013 (18%) | 2837 (17%) | 4009 (16%) | |
75-99K | 606 (11%) | 1892 (11%) | 2978 (12%) | |
100-199K | 1489 (27%) | 4547 (27%) | 6879 (28%) | |
200K+ | 890 (16%) | 2493 (15%) | 3625 (15%) | |
Highest Education Level | No Diploma | 227 | 977 | 1308 |
Diploma or GED | 883 | 4203 | 7019 | |
Some College | 1165 | 4236 | 6034 | |
Assoc. Degree | 518 | 2335 | 3687 | |
Bachelors Degree | 3675 | 9430 | 13850 | |
Higher Degree | 2242 | 6282 | 8967 | |
Total Housing Units | 5,883 | 17,952 | 26,341 | |
--Owner-Occupied | 2,382 | 9,367 | 15,182 | |
--Renter-Occupied | 3,069 | 7,002 | 8,669 | |
Owner-Occupied Values | < 100K | 7 | 220 | 648 |
100-199K | 100 | 448 | 738 | |
200-299K | 300 | 1695 | 2634 | |
300-399K | 322 | 1705 | 2671 | |
400-499K | 290 | 1113 | 1878 | |
500K+ | 1364 | 4186 | 6615 | |
Total Working Age Population | 9,727 | 30,339 | 45,069 | |
In Work Force | 7,058 | 20,768 | 30,559 | |
Not In Work Force | 2,669 | 9,571 | 14,511 | |
Workforce Employed | 6,348 | 19,291 | 28,726 | |
Workforce Unemployed | 61 | 376 | 591 | |
Civlian Workforce | 6,409 | 19,667 | 29,316 | |
Military Workforce | 649 | 1,101 | 1,243 | |
Total Households | 5,451 | 16,369 | 23,852 | |
Family Households | 2,090 | 8,438 | 13,223 | |
Non-Family Households | 3,361 | 7,932 | 10,628 | |
Married Couple | 1,840 | 6,936 | 10,913 | |
Other Family | 250 | 1,502 | 2,311 | |
Married w/Child | 419 | 2,032 | 3,226 | |
Single Male w/Child | 87 | 216 | 301 | |
Single Female w/Child | 47 | 609 | 814 |
Population Change Last Two Decades - Plus Projection
2000 | % | 2010 | % | 2020 | % | 2030 | |
---|---|---|---|---|---|---|---|
Maine | 1,274,923 | +4 | 1,328,361 | +1 | 1,335,260 | 0 | 1,341,046 |
York County | 186,742 | +6 | 197,131 | +6 | 208,062 | +5 | 217,689 |
New Hampshire | 1,235,786 | +7 | 1,316,470 | +3 | 1,349,908 | +4 | 1,402,878 |
Rockingham County | 277,359 | +6 | 295,223 | +4 | 307,013 | +5 | 321,441 |
Strafford County | 112,233 | +10 | 123,143 | +5 | 128,801 | +6 | 136,472 |
Total Working Age Population:
Total Households:
Total Working Age Population:
Total Households:
Total Working Age Population:
Total Households: