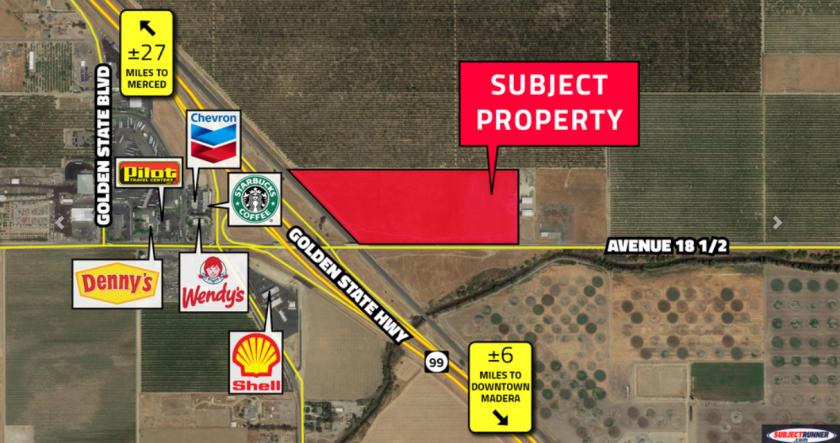
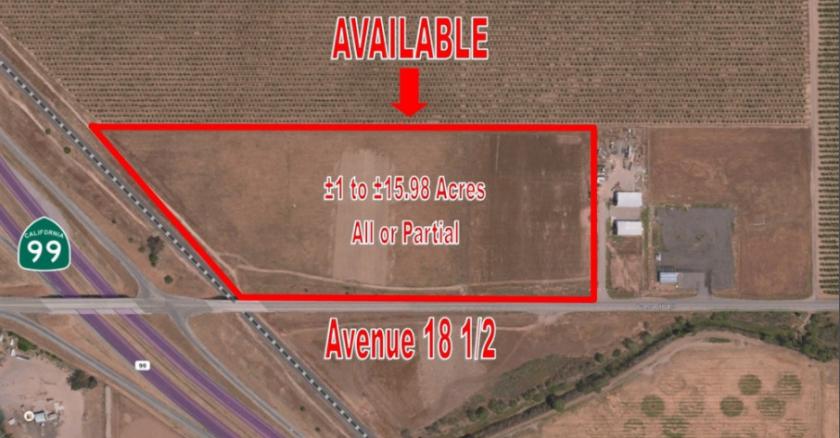
±1 to ±15.98 acres undeveloped highway commercial land located at the northwest intersection of Exit 159 - Avenue 18 1/2 - State Route CA 99, adjacent to the city of Madera, CA. Property will serve within the traffic access pattern to the proposed new North Fork Rancheria Resort Hotel and Casino consisting of 200 guest rooms, restaurants and an entertainment lounge. Highly visible corner location w/ easy Highway Exit and Entrance with long frontage along HWY 99. High traffic attracted to the site via the newly developed Pilot Travel Center, Chevron, Shell,, nearby Airport, Industrial park, and various residential developments (existing Madera Highlands and new tracts). One Parcel of Highway Commercial land totaling ±15.98 acres that can be sold individually, parceled into smaller pads, or purchased all together. Parcel(s) offered for sale, ground lease, lease w/ option, seller-carry, etc.Avenue 18 1/2 is a full interchange Highway 99 overpass, a natural resting spot for travelers and commuters to and from some of the California destinations such as Yosemite National Park, San Francisco, Sacramento, Santa Cruz, Monterey, Pismo Beach, Santa Barbara & Los Angeles. Excellent big-box site, fast food, fuel station, hotel, super market shopping center, lodging, restaurant, freeway-oriented hotel, and vehicle sales. Parcels offered for sale, ground lease, lease w/ option, seller-carry, etc.Strategically positioned at the full interchange with both north and south bound loop on and off-ramps, which carry approximately ±148,089 cars per day; CA-99: ±58,770 northbound and ±65,351 westbound; Ave 18 1/2: ±11,729 eastbound and ±12,239 southbound. The newer multi-million dollar interchange project recently completed connecting to the realigned thoroughfares on the east and west side of the interchange. Existing ramps dispense traffic directly at signalized intersection at the subject property. Flexible commercial zoning uses include convenience store, car wash, hotel, conference center, quick serve & sit down restaurants, food market, retail strip center, professional office, etc. All wet & dry utilities at site. Est 1,251 feet of Hwy 99 visibility.