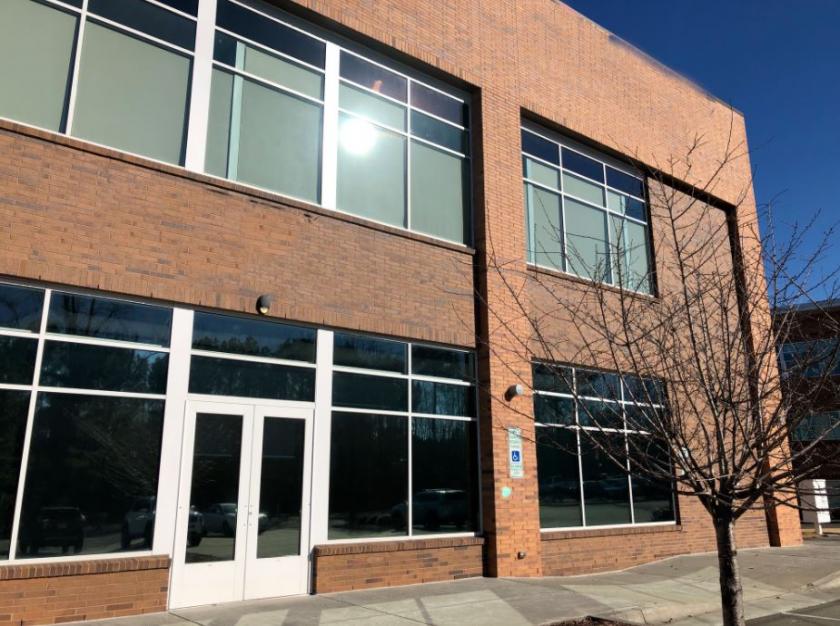
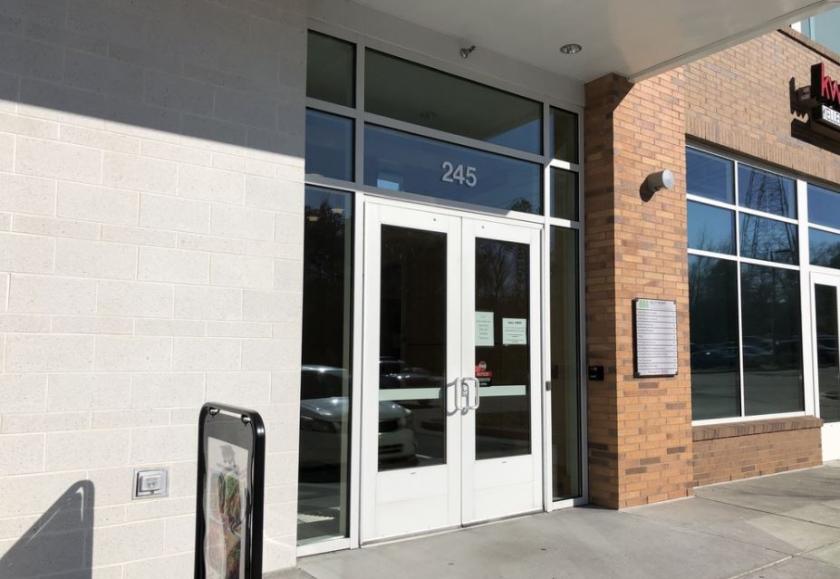
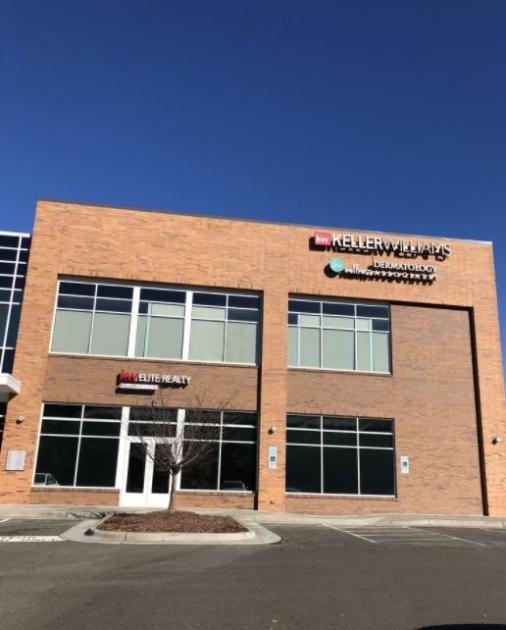
Office Space
245 North Carolina 54 Durham, NC 27713
245 North Carolina 54 Durham, NC 27713
Details & Description
Property Highlights
- • Class A Office Space
- • Intersection of NC-54, Fayetteville Rd I-40
- • Great On-Site Amenities
- • Epicenter of Research Triangle
- • Close to Everything
- • High Visibility Signage
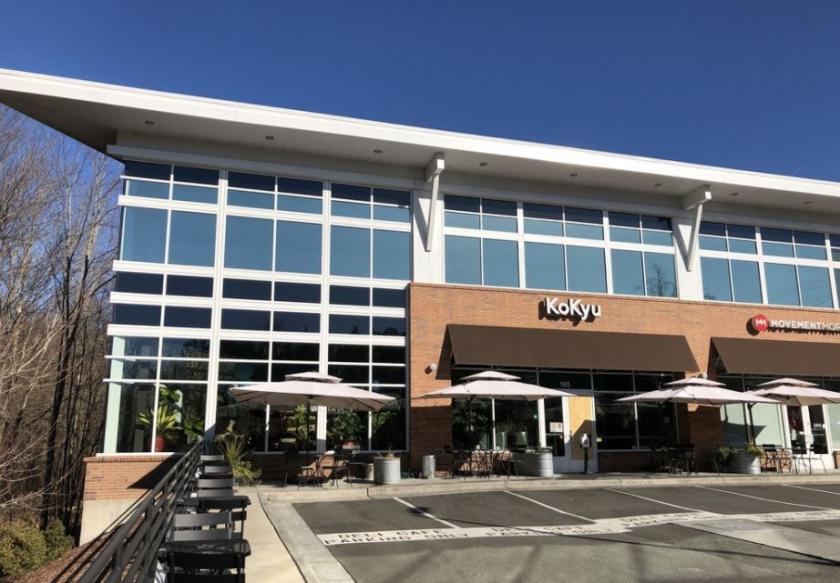
Additional Photos
Listing Agents

Vandan Gandhi
KW Commercial
O: 919-475-5769
van.kwcommercial@gmail.com
KW Commercial
O: 919-475-5769
van.kwcommercial@gmail.com
While we strive to provide the most accurate information, all listing information, and demographic data, is provided by third-parties. As such, MyEListing will not be responsible for the accuracy of the information. It is strongly recommended that you verify all information with the listing agent, and any relevant agencies, prior to making any decisions.


