Zoned Commercial
3.72 miles from Rt. 33
Currently no gas from Rt. 33 for 8.5 miles.
Main corridor for Jerome Village and Dublin residents to Rt. 33
2900 planned homes for Jerome Village
Nationwide purchased 1600 acres for mixed use development less than 1 mile away.
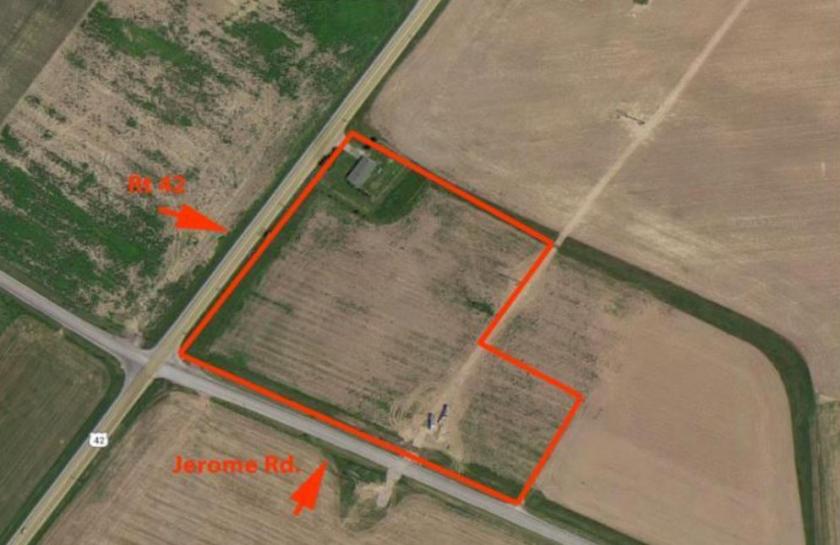
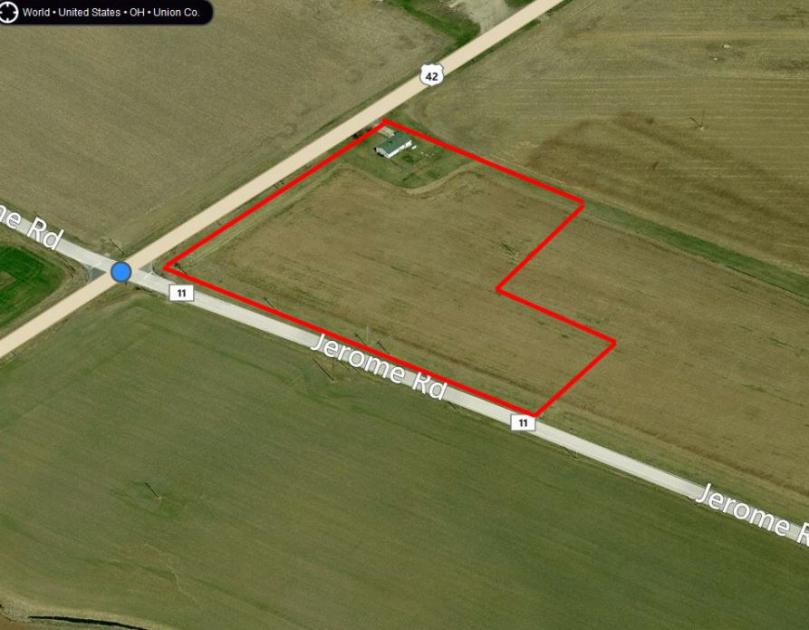
8 acres at SE corner of Jerome Rd. and Rt. 42
Located in the path of progress. Jerome Rd is the main artery to 42 and to Route 33 for the people that live in northern Dublin and in Jerome Village. Jerome Village is a planned community with over 2900 homes sites. Over 2000 have been built. It is also one of the fastest growing communities in Ohio.
https://jeromevillage.com/?doing_wp_cron=1534772282.5967669486999511718750
Honda continues to expand operations at their Marysville plant and just added 300 jobs this year. Jerome Rd is a main corridor for those workers.
This community is under served and is in dire need of a gas station and grocery store. We currently have 8 acres of ground and have the option for more. This 8 acres is on the northeast corner of Jerome and 42. There are currently no gas stations from St Rt 33 until you get to South Section Line Rd which is 8.5 miles. Even then you aren’t going to run into it unless you are headed to Delaware on 42. In addition, the former owner of this land is deed restricted for gas for the next 11 years unless Kroger comes in (they are definitely looking) .
Nationwide has bought 1600 acres of land and plans a mixed use development.
http://www.nationwiderealtyinvestors.com/portfolio/jerome-village/.
This is a great opportunity to get in front of the competition.
No part of this information may be copied, reproduced, repurposed, or screen-captured for any commercial purpose without prior written authorization from MyEListing.
While we strive to provide the most accurate information, all listing information, and demographic data, is provided by third-parties. As such, MyEListing will not be responsible for the accuracy of the information. It is strongly recommended that you verify all information with the listing agent, and any relevant agencies, prior to making any decisions.
What is the asking price for 13220 U.S. 42 in Plain City?
The asking price for 13220 U.S. 42 is $1.00 a SF per Year
What kind of Land is the propery at 13220 U.S. 42?
The property at 13220 U.S. 42 Plain City, OH 43064 is listed as a Mixed Use Land Land property
What is the population within 1 mile of 13220 U.S. 42 in Plain City?
The population within 1 mile of 13220 U.S. 42 Plain City, OH 43064 is 409 people.
Who do I contact for questions about 13220 U.S. 42?
You should contact the listing agent,
Martha Hunley , for any details regarding this commercial listing.