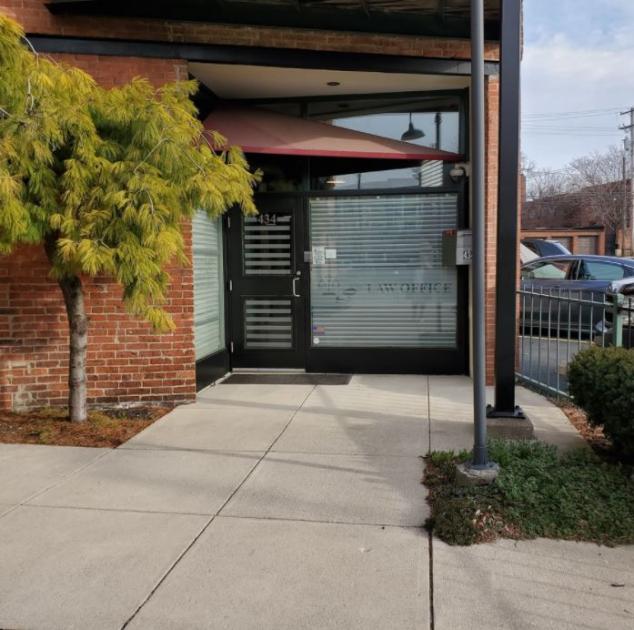
Office Space
434 East Rich Street Columbus, OH 43215
434 East Rich Street Columbus, OH 43215

Details & Description
Property Highlights
- • Excellent location
- • Convenient to all of Downtown
- • Very Walkable
- • Easy Access to I 70 I 71
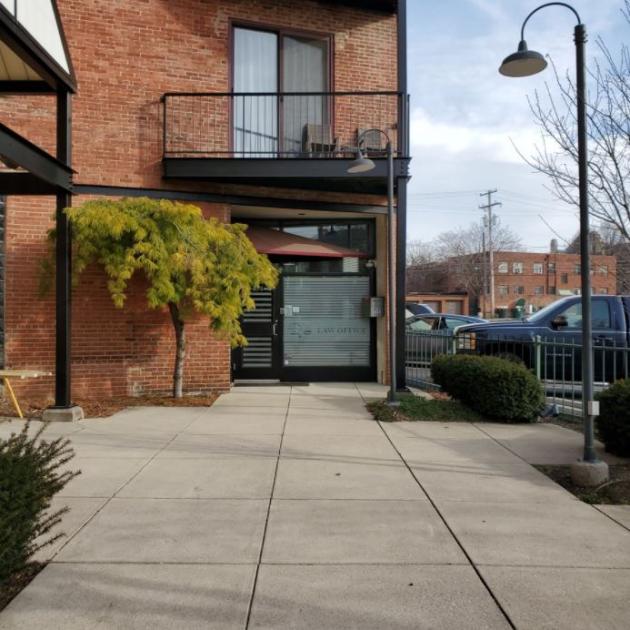
Additional Photos

Listing Agents

Martha Hunley
KW Commercial
O: 614-314-5555
martha@therealtygroup.us
KW Commercial
O: 614-314-5555
martha@therealtygroup.us
While we strive to provide the most accurate information, all listing information, and demographic data, is provided by third-parties. As such, MyEListing will not be responsible for the accuracy of the information. It is strongly recommended that you verify all information with the listing agent, and any relevant agencies, prior to making any decisions.


