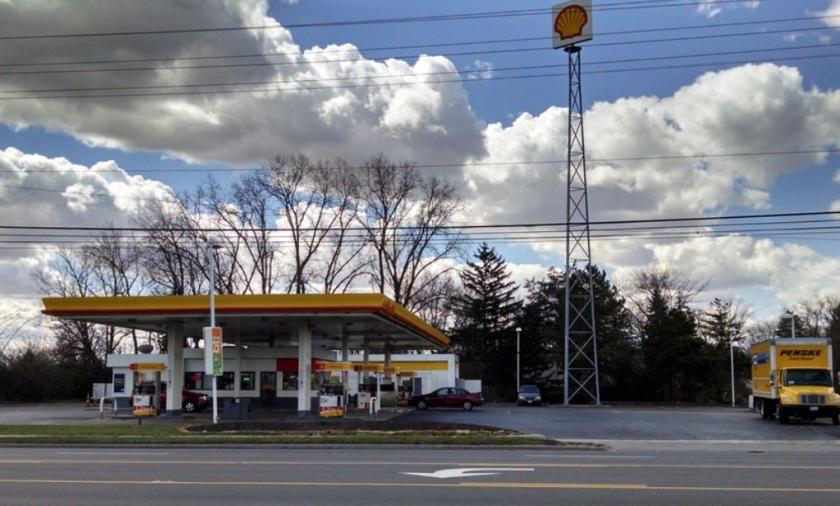
Retail Space
845 North Wilson Road Columbus, OH 43204
845 North Wilson Road Columbus, OH 43204
Details & Description
Property Highlights
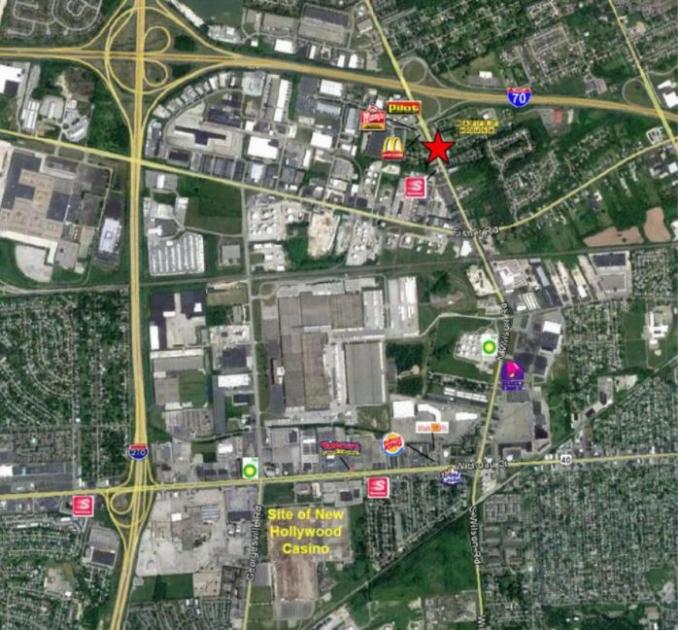
- • Excellent Location one block off exit from I-70
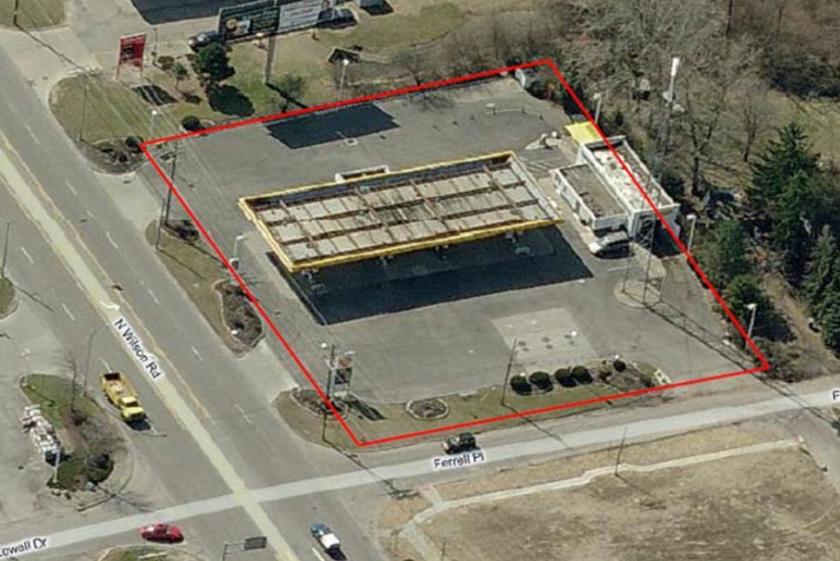
- • Corner with three curb cuts
- • 800 Sq Ft Building on .93 acres
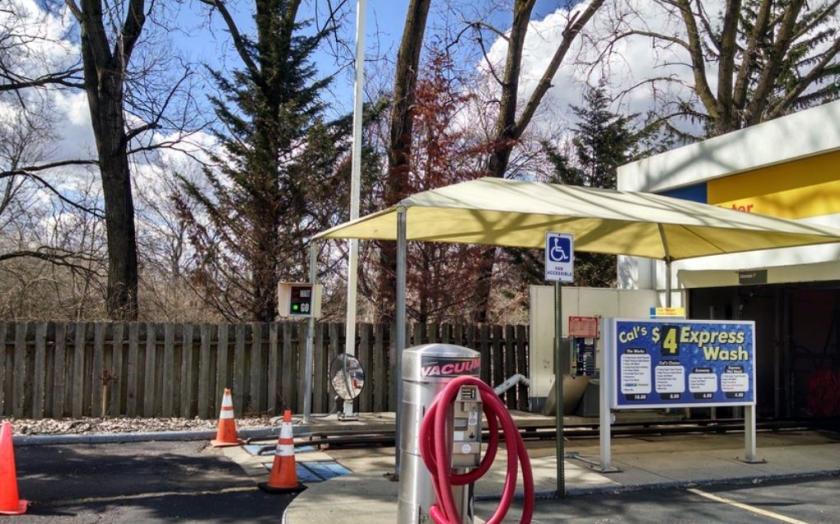
- • Tunnel Car wash--equipment replaced in 2016
Additional Photos
Listing Agents

Martha Hunley
KW Commercial
O: 614-314-5555
martha@therealtygroup.us
KW Commercial
O: 614-314-5555
martha@therealtygroup.us
While we strive to provide the most accurate information, all listing information, and demographic data, is provided by third-parties. As such, MyEListing will not be responsible for the accuracy of the information. It is strongly recommended that you verify all information with the listing agent, and any relevant agencies, prior to making any decisions.


