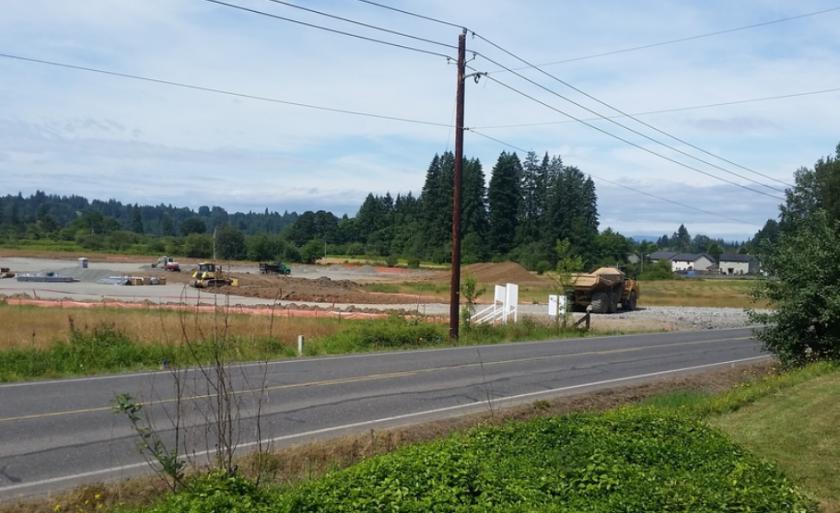
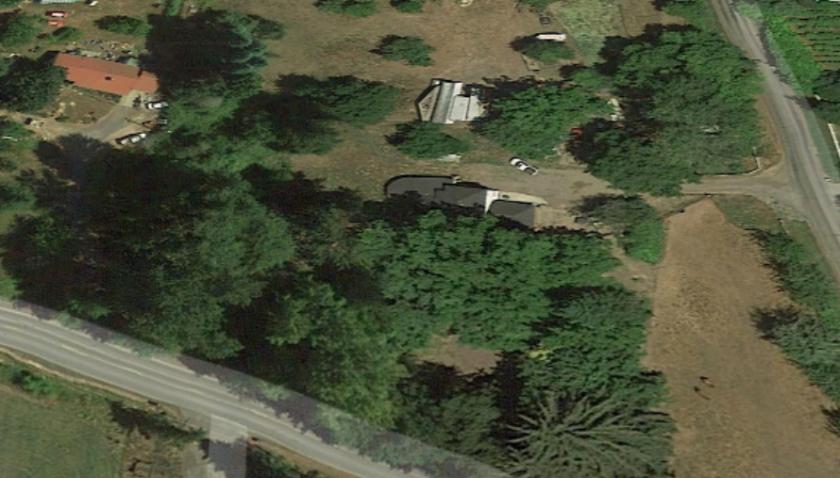
1-Mile | 3-Miles | 5-Miles | ||
---|---|---|---|---|
Total Population | 955 | 7,849 | 19,341 | |
Population Median Age | 41 | 41 | 41 | |
Population by Age | 0-9 Yrs | 100 (10%) | 846 (10%) | 2162 (11%) |
10-19 Yrs | 150 (15%) | 1205 (15%) | 3031 (15%) | |
20-29 Yrs | 84 (8%) | 667 (8%) | 1553 (8%) | |
30-39 Yrs | 93 (9%) | 792 (10%) | 2192 (11%) | |
40-49 Yrs | 143 (14%) | 1008 (12%) | 2326 (12%) | |
50-59 Yrs | 155 (16%) | 1235 (15%) | 2932 (15%) | |
60-69 Yrs | 128 (13%) | 1167 (14%) | 2847 (14%) | |
70+ Yrs | 102 (10%) | 929 (11%) | 2298 (11%) | |
Median HH Income | $95,659 | $93,314 | $90,401 | |
Total Household Income | < 24K | 16 (5%) | 163 (6%) | 499 (7%) |
25-49K | 60 (18%) | 466 (17%) | 1153 (17%) | |
50-74K | 33 (10%) | 361 (13%) | 992 (15%) | |
75-99K | 60 (18%) | 448 (17%) | 1053 (15%) | |
100-199K | 114 (35%) | 904 (34%) | 2212 (33%) | |
200K+ | 34 (10%) | 293 (11%) | 676 (10%) | |
Highest Education Level | No Diploma | 30 | 300 | 857 |
Diploma or GED | 177 | 1591 | 3635 | |
Some College | 192 | 1573 | 3892 | |
Assoc. Degree | 124 | 772 | 1560 | |
Bachelors Degree | 88 | 840 | 2345 | |
Higher Degree | 41 | 365 | 980 | |
Total Housing Units | 333 | 2,772 | 7,066 | |
--Owner-Occupied | 281 | 2,262 | 5,482 | |
--Renter-Occupied | 37 | 372 | 1,103 | |
Owner-Occupied Values | < 100K | 2 | 93 | 231 |
100-199K | 16 | 164 | 306 | |
200-299K | 67 | 415 | 928 | |
300-399K | 85 | 605 | 1356 | |
400-499K | 68 | 464 | 1169 | |
500K+ | 43 | 522 | 1492 | |
Total Working Age Population | 759 | 6,270 | 15,297 | |
In Work Force | 425 | 3,540 | 8,591 | |
Not In Work Force | 334 | 2,730 | 6,706 | |
Workforce Employed | 404 | 3,278 | 8,069 | |
Workforce Unemployed | 19 | 251 | 487 | |
Civlian Workforce | 423 | 3,530 | 8,556 | |
Military Workforce | 2 | 10 | 35 | |
Total Households | 318 | 2,635 | 6,585 | |
Family Households | 274 | 2,253 | 5,471 | |
Non-Family Households | 44 | 382 | 1,114 | |
Married Couple | 248 | 1,919 | 4,672 | |
Other Family | 26 | 335 | 800 | |
Married w/Child | 81 | 625 | 1,615 | |
Single Male w/Child | 1 | 51 | 149 | |
Single Female w/Child | 17 | 119 | 223 |
Population Change Last Two Decades - Plus Projection
2000 | % | 2010 | % | 2020 | % | 2030 | |
---|---|---|---|---|---|---|---|
Washington | 5,894,121 | +14 | 6,724,540 | +14 | 7,638,415 | +11 | 8,503,178 |
Clark County | 345,238 | +23 | 425,363 | +17 | 499,400 | +16 | 576,879 |
Cowlitz County | 92,948 | +10 | 102,410 | +6 | 108,885 | +5 | 114,611 |
Total Working Age Population:
Total Households:
Total Working Age Population:
Total Households:
Total Working Age Population:
Total Households: