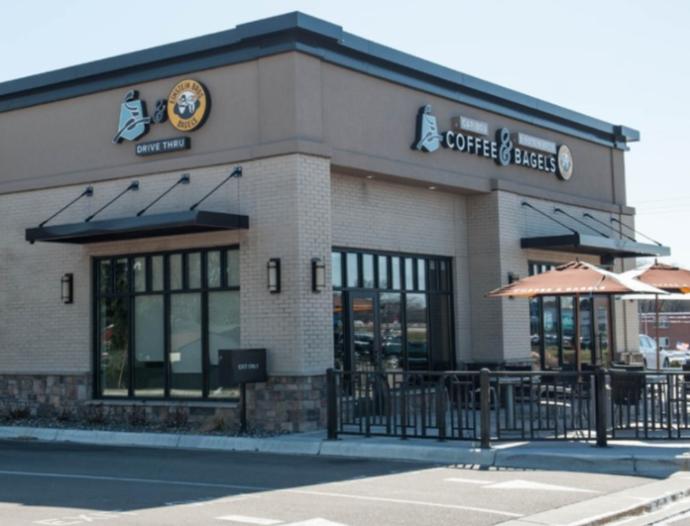
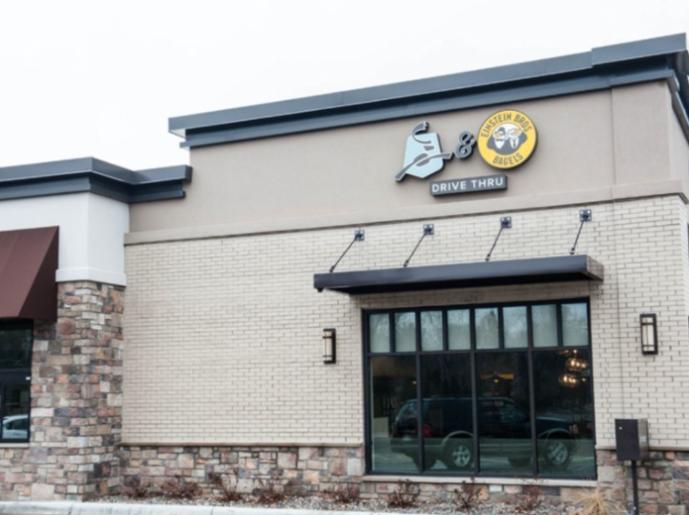
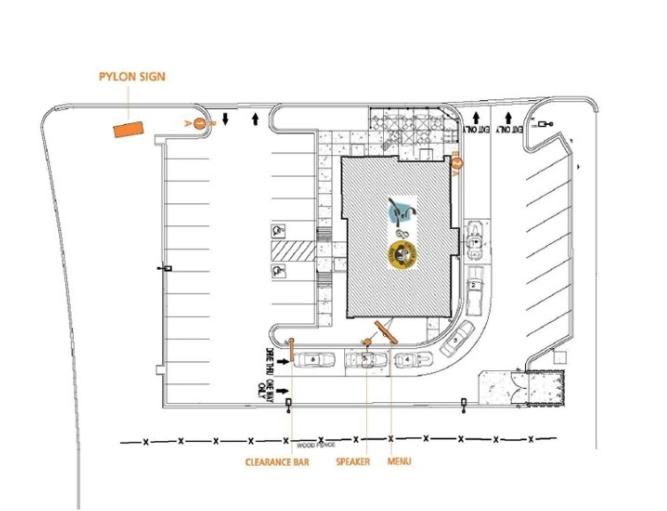
KW Commercial is pleased to market for sale this fee simple, single tenant, net lease investment property occupied by Caribou Coffee Company and Einstein Bros Bagel. Caribou Coffee is the 2nd largest company-operated premium coffee house in the U.S. Parent company, JAB Holding (S&P A-), owns this Woodbury location. There are 8 years remaining on the 10 year lease. There are 10% rental increases every five years including the option periods.The 2,550 square foot Coffee & Bagels property is located at the Century Ave and Interstate 94 interchange (84,000 vpd.) I-94 is a major east-west thoroughfare through the Twin Cities. Customers have easy on and off access from I-94 and a dedicated turn lane is available into the Caribou site. Construction of the building was completed in 2018 and the property is part of a larger mixed-use development that includes a Country Inn & Suites by Radisson as well as office, retail and a senior care center. There are over 76,000 people living within three miles of the property with an average household income of $71,515.In 2014, Caribou Coffee and Einstein Bros Bagels introduced a new concept for specialty coffee and fresh-baked bagels through the opening of a new coffee and bagels concept. Coffee & Bagel Brands, operator of the Caribou Coffee and Einstein Bros Bagels partnership, has over 4,600 total employees across all of its locations and generates 255 million in sales (USD). Customers will find Caribou Coffee in Einstein Bros Bagel locations and Einstein Bros Bagels in Caribou Coffee locations.Founded in 1992, Caribou Coffee has more than 311 company owned stores and 139 domestic license locations in 18 states and 297 international franchise stores in 11 countries. Known for its commitment to sustainability, the Company was the first major U.S. coffeehouse to serve 100% Rainforest Alliance Certified coffees. Coffee products can also be found in grocery stores, mass retailers, club stores, food service providers, hotels, and online.Einstein Bros Bagels is a leading quick-casual neighborhood bagelry. Known for its fresh baked bagels available in a variety of flavors, Einstein Bros also serves gourmet bagel sandwiches, coffee, salads, sweets and snacks. Einstein has 346 company owned stores, 330 domestic license locations, and 59 franchises in 40 states.