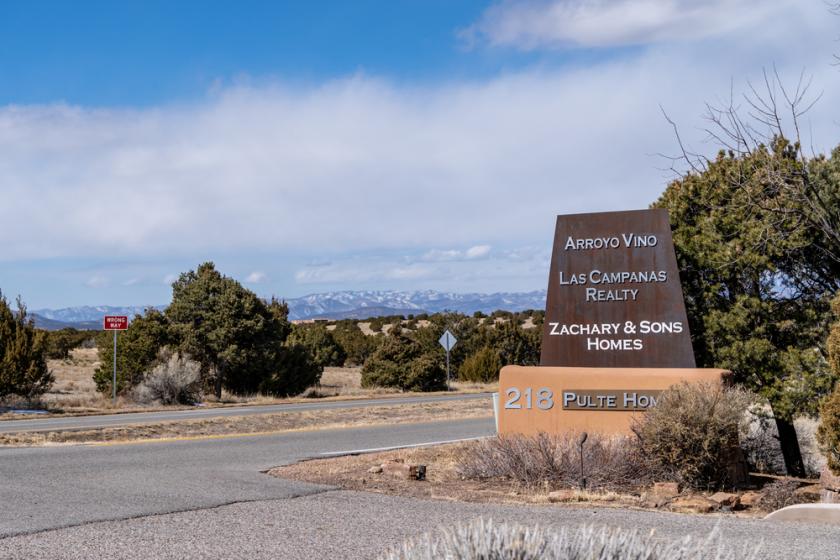
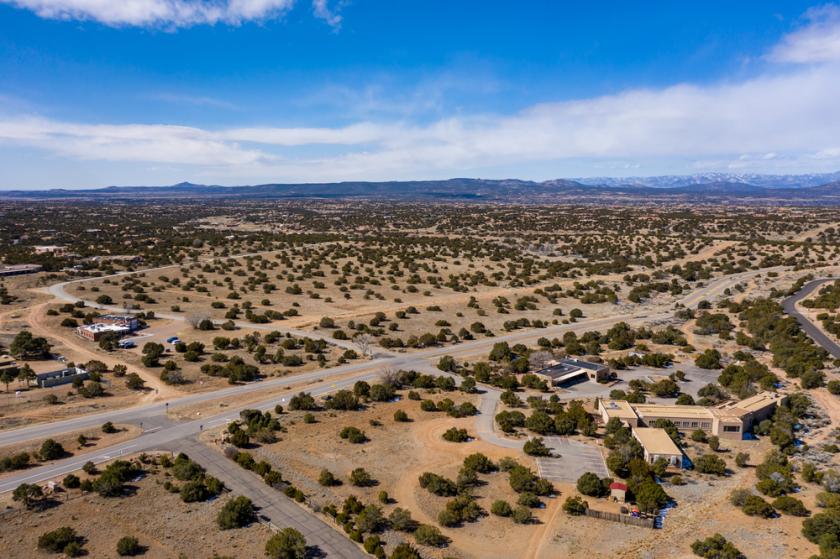
1-Mile | 3-Miles | 5-Miles | ||
---|---|---|---|---|
Total Population | 505 | 17,584 | 65,728 | |
Population Median Age | 54 | 48 | 45 | |
Population by Age | 0-9 Yrs | 25 (4%) | 1227 (6%) | 5953 (9%) |
10-19 Yrs | 37 (7%) | 1294 (7%) | 6497 (9%) | |
20-29 Yrs | 20 (3%) | 1478 (8%) | 7164 (10%) | |
30-39 Yrs | 40 (7%) | 2517 (14%) | 8081 (12%) | |
40-49 Yrs | 35 (6%) | 2179 (12%) | 7914 (12%) | |
50-59 Yrs | 92 (18%) | 2485 (14%) | 8710 (13%) | |
60-69 Yrs | 136 (26%) | 3196 (18%) | 10574 (16%) | |
70+ Yrs | 120 (23%) | 3207 (18%) | 10836 (16%) | |
Median HH Income | $78,311 | $58,777 | $57,260 | |
Total Household Income | < 24K | 19 (8%) | 1639 (19%) | 5699 (19%) |
25-49K | 53 (23%) | 1952 (23%) | 7089 (24%) | |
50-74K | 38 (16%) | 1540 (18%) | 5331 (18%) | |
75-99K | 30 (13%) | 923 (11%) | 3545 (12%) | |
100-199K | 58 (25%) | 1653 (20%) | 5440 (18%) | |
200K+ | 30 (13%) | 523 (6%) | 1902 (6%) | |
Highest Education Level | No Diploma | 26 | 1028 | 5999 |
Diploma or GED | 77 | 3216 | 10723 | |
Some College | 64 | 2728 | 9061 | |
Assoc. Degree | 22 | 707 | 2708 | |
Bachelors Degree | 105 | 3438 | 10657 | |
Higher Degree | 140 | 3424 | 10959 | |
Total Housing Units | 259 | 9,649 | 34,480 | |
--Owner-Occupied | 194 | 5,207 | 17,737 | |
--Renter-Occupied | 35 | 3,021 | 11,269 | |
Owner-Occupied Values | < 100K | 13 | 371 | 1863 |
100-199K | 11 | 627 | 2860 | |
200-299K | 16 | 1312 | 4424 | |
300-399K | 30 | 1261 | 2905 | |
400-499K | 27 | 672 | 1536 | |
500K+ | 97 | 964 | 4149 | |
Total Working Age Population | 460 | 15,645 | 56,145 | |
In Work Force | 232 | 9,411 | 33,458 | |
Not In Work Force | 228 | 6,233 | 22,686 | |
Workforce Employed | 228 | 8,892 | 31,982 | |
Workforce Unemployed | 4 | 513 | 1,454 | |
Civlian Workforce | 232 | 9,405 | 33,436 | |
Military Workforce | 0 | 6 | 22 | |
Total Households | 229 | 8,228 | 29,006 | |
Family Households | 151 | 3,972 | 15,213 | |
Non-Family Households | 78 | 4,256 | 13,793 | |
Married Couple | 129 | 2,723 | 10,590 | |
Other Family | 22 | 1,249 | 4,623 | |
Married w/Child | 18 | 565 | 2,942 | |
Single Male w/Child | 1 | 100 | 613 | |
Single Female w/Child | 8 | 399 | 1,756 |
Population Change Last Two Decades - Plus Projection
2000 | % | 2010 | % | 2020 | % | 2030 | |
---|---|---|---|---|---|---|---|
New Mexico | 1,819,046 | +13 | 2,059,179 | +6 | 2,187,183 | +6 | 2,308,475 |
Santa Fe County | 129,292 | +12 | 144,170 | +5 | 151,767 | +7 | 162,782 |
Total Working Age Population:
Total Households:
Total Working Age Population:
Total Households:
Total Working Age Population:
Total Households: