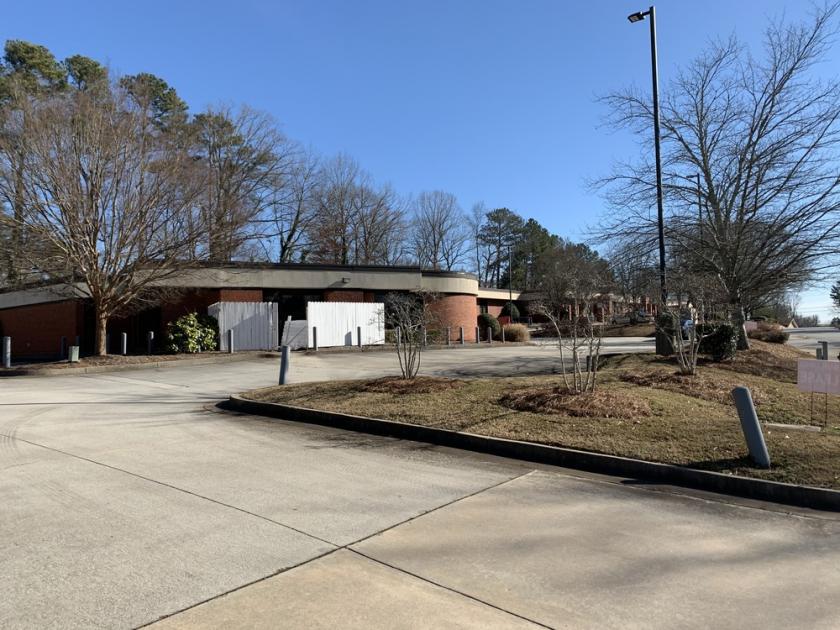
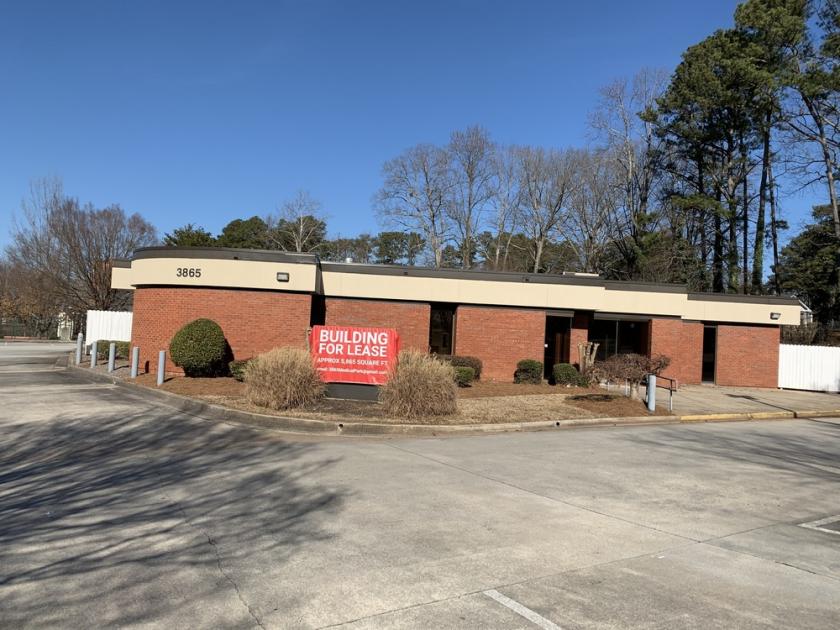
1-Mile | 3-Miles | 5-Miles | ||
---|---|---|---|---|
Total Population | 9,012 | 66,371 | 180,567 | |
Population Median Age | 37 | 37 | 36 | |
Population by Age | 0-9 Yrs | 1319 (14%) | 9340 (14%) | 26699 (14%) |
10-19 Yrs | 1150 (12%) | 8879 (13%) | 23913 (13%) | |
20-29 Yrs | 1181 (13%) | 8828 (13%) | 24106 (13%) | |
30-39 Yrs | 1539 (17%) | 10205 (15%) | 27965 (15%) | |
40-49 Yrs | 975 (10%) | 8036 (12%) | 24893 (13%) | |
50-59 Yrs | 1127 (12%) | 9331 (14%) | 23211 (12%) | |
60-69 Yrs | 710 (7%) | 5851 (8%) | 16243 (8%) | |
70+ Yrs | 1011 (11%) | 5899 (8%) | 13535 (7%) | |
Median HH Income | $52,354 | $64,894 | $64,175 | |
Total Household Income | < 24K | 768 (21%) | 3683 (15%) | 9833 (15%) |
25-49K | 915 (25%) | 5181 (22%) | 14930 (23%) | |
50-74K | 966 (27%) | 4726 (20%) | 12218 (19%) | |
75-99K | 358 (10%) | 3320 (14%) | 8614 (13%) | |
100-199K | 502 (14%) | 5413 (23%) | 14618 (22%) | |
200K+ | 60 (1%) | 1105 (4%) | 3456 (5%) | |
Highest Education Level | No Diploma | 667 | 4890 | 15912 |
Diploma or GED | 1911 | 12363 | 30835 | |
Some College | 1385 | 9100 | 23875 | |
Assoc. Degree | 431 | 3788 | 9600 | |
Bachelors Degree | 1396 | 9358 | 25231 | |
Higher Degree | 394 | 4417 | 13523 | |
Total Housing Units | 3,814 | 24,852 | 68,473 | |
--Owner-Occupied | 1,551 | 15,349 | 39,968 | |
--Renter-Occupied | 2,018 | 8,080 | 23,699 | |
Owner-Occupied Values | < 100K | 270 | 1736 | 5370 |
100-199K | 820 | 7590 | 17179 | |
200-299K | 379 | 4121 | 10101 | |
300-399K | 61 | 1049 | 4191 | |
400-499K | 9 | 398 | 1628 | |
500K+ | 12 | 455 | 1500 | |
Total Working Age Population | 6,878 | 51,253 | 139,037 | |
In Work Force | 4,493 | 34,868 | 95,761 | |
Not In Work Force | 2,384 | 16,385 | 43,277 | |
Workforce Employed | 4,305 | 33,341 | 90,811 | |
Workforce Unemployed | 187 | 1,522 | 4,811 | |
Civlian Workforce | 4,492 | 34,863 | 95,622 | |
Military Workforce | 1 | 5 | 138 | |
Total Households | 3,569 | 23,429 | 63,668 | |
Family Households | 1,996 | 16,309 | 44,582 | |
Non-Family Households | 1,573 | 7,121 | 19,086 | |
Married Couple | 1,019 | 10,714 | 29,763 | |
Other Family | 978 | 5,595 | 14,818 | |
Married w/Child | 494 | 4,697 | 13,051 | |
Single Male w/Child | 65 | 551 | 1,342 | |
Single Female w/Child | 536 | 2,271 | 6,420 |
Population Change Last Two Decades - Plus Projection
2000 | % | 2010 | % | 2020 | % | 2030 | |
---|---|---|---|---|---|---|---|
Georgia | 8,186,453 | +18 | 9,687,653 | +12 | 10,833,472 | +13 | 12,292,423 |
Cobb County | 607,751 | +13 | 688,078 | +15 | 790,588 | +19 | 938,747 |
Douglas County | 92,174 | +44 | 132,403 | +15 | 151,906 | +20 | 182,157 |
Fulton County | 816,006 | +13 | 920,581 | +19 | 1,099,181 | +18 | 1,300,861 |
Total Working Age Population:
Total Households:
Total Working Age Population:
Total Households:
Total Working Age Population:
Total Households: