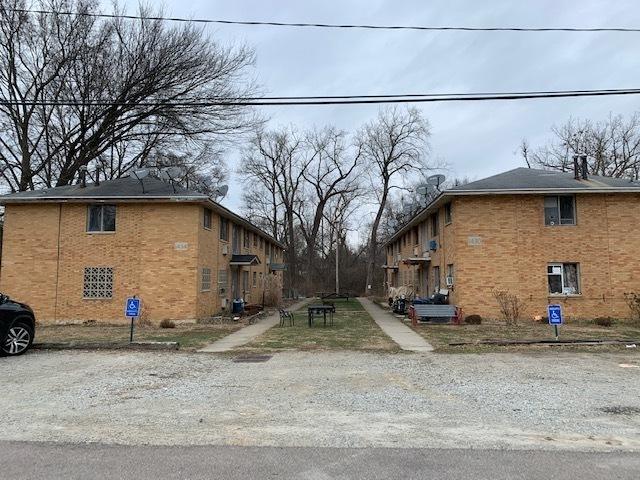
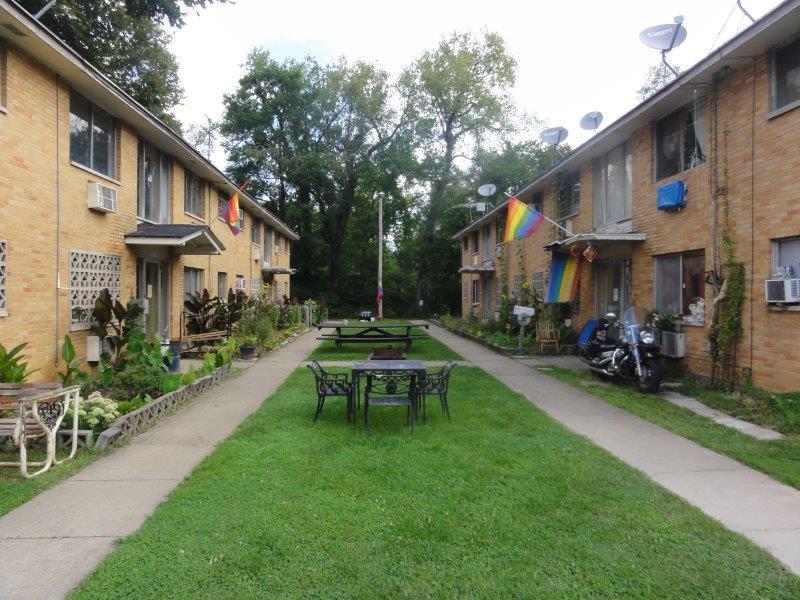
1-Mile | 3-Miles | 5-Miles | ||
---|---|---|---|---|
Total Population | 9,960 | 70,089 | 158,907 | |
Population Median Age | 40 | 39 | 38 | |
Population by Age | 0-9 Yrs | 1208 (12%) | 8813 (12%) | 19628 (12%) |
10-19 Yrs | 1252 (12%) | 8905 (12%) | 22824 (14%) | |
20-29 Yrs | 1427 (14%) | 9660 (13%) | 26624 (16%) | |
30-39 Yrs | 1107 (11%) | 9065 (12%) | 18772 (11%) | |
40-49 Yrs | 1132 (11%) | 7859 (11%) | 17160 (10%) | |
50-59 Yrs | 1422 (14%) | 9619 (13%) | 20609 (12%) | |
60-69 Yrs | 1150 (11%) | 8588 (12%) | 16976 (10%) | |
70+ Yrs | 1261 (12%) | 7578 (10%) | 16314 (10%) | |
Median HH Income | $27,561 | $28,286 | $32,424 | |
Total Household Income | < 24K | 2087 (45%) | 14367 (44%) | 25980 (39%) |
25-49K | 1408 (30%) | 8963 (28%) | 18218 (27%) | |
50-74K | 660 (14%) | 4252 (13%) | 9351 (14%) | |
75-99K | 278 (6%) | 2221 (6%) | 4909 (7%) | |
100-199K | 153 (3%) | 1909 (5%) | 5544 (8%) | |
200K+ | 43 (0%) | 222 (0%) | 1066 (1%) | |
Highest Education Level | No Diploma | 1161 | 7852 | 16795 |
Diploma or GED | 2209 | 14691 | 31134 | |
Some College | 2007 | 13357 | 26379 | |
Assoc. Degree | 459 | 4031 | 8337 | |
Bachelors Degree | 614 | 4635 | 11135 | |
Higher Degree | 299 | 3012 | 7514 | |
Total Housing Units | 6,793 | 43,579 | 82,950 | |
--Owner-Occupied | 2,451 | 13,808 | 30,558 | |
--Renter-Occupied | 2,178 | 18,127 | 34,510 | |
Owner-Occupied Values | < 100K | 2339 | 11726 | 22364 |
100-199K | 84 | 1550 | 5442 | |
200-299K | 0 | 325 | 1441 | |
300-399K | 0 | 43 | 584 | |
400-499K | 12 | 50 | 253 | |
500K+ | 16 | 114 | 476 | |
Total Working Age Population | 8,066 | 55,955 | 127,918 | |
In Work Force | 4,272 | 31,418 | 72,005 | |
Not In Work Force | 3,794 | 24,537 | 55,913 | |
Workforce Employed | 3,643 | 27,025 | 63,429 | |
Workforce Unemployed | 629 | 4,350 | 8,399 | |
Civlian Workforce | 4,272 | 31,374 | 71,829 | |
Military Workforce | 0 | 44 | 176 | |
Total Households | 4,629 | 31,934 | 65,068 | |
Family Households | 2,566 | 16,033 | 34,822 | |
Non-Family Households | 2,063 | 15,902 | 30,246 | |
Married Couple | 666 | 5,926 | 16,011 | |
Other Family | 1,900 | 10,106 | 18,812 | |
Married w/Child | 135 | 1,644 | 5,292 | |
Single Male w/Child | 112 | 1,075 | 1,983 | |
Single Female w/Child | 712 | 4,623 | 8,622 |
Population Change Last Two Decades - Plus Projection
2000 | % | 2010 | % | 2020 | % | 2030 | |
---|---|---|---|---|---|---|---|
Ohio | 11,353,140 | +2 | 11,536,504 | 0 | 11,574,870 | 0 | 11,615,100 |
Montgomery County | 559,062 | -4 | 535,153 | -4 | 513,830 | -3 | 496,650 |
Total Working Age Population:
Total Households:
Total Working Age Population:
Total Households:
Total Working Age Population:
Total Households: