Commercial Land
Simmons Rd and MacArthur Edmond, OK 73025
Simmons Rd and MacArthur Edmond, OK 73025
Details & Description
Property Highlights
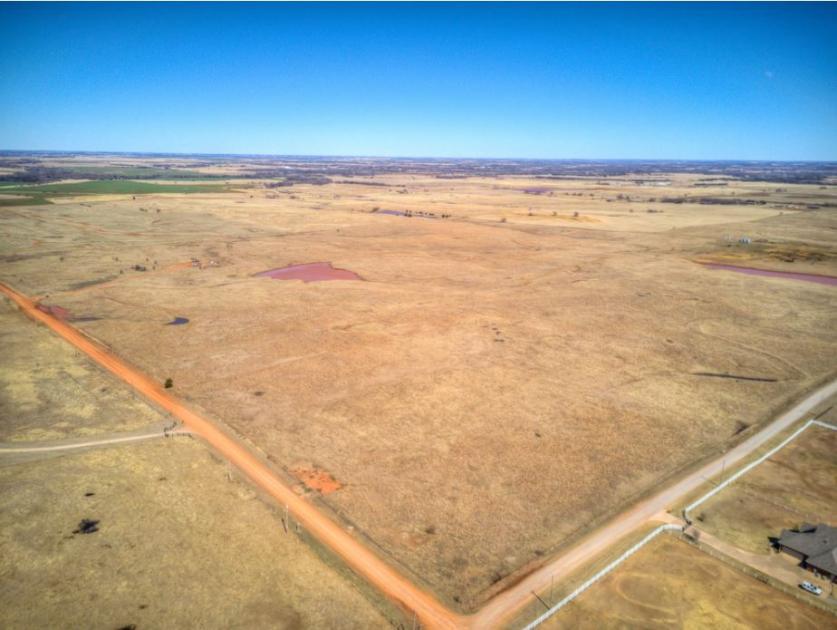
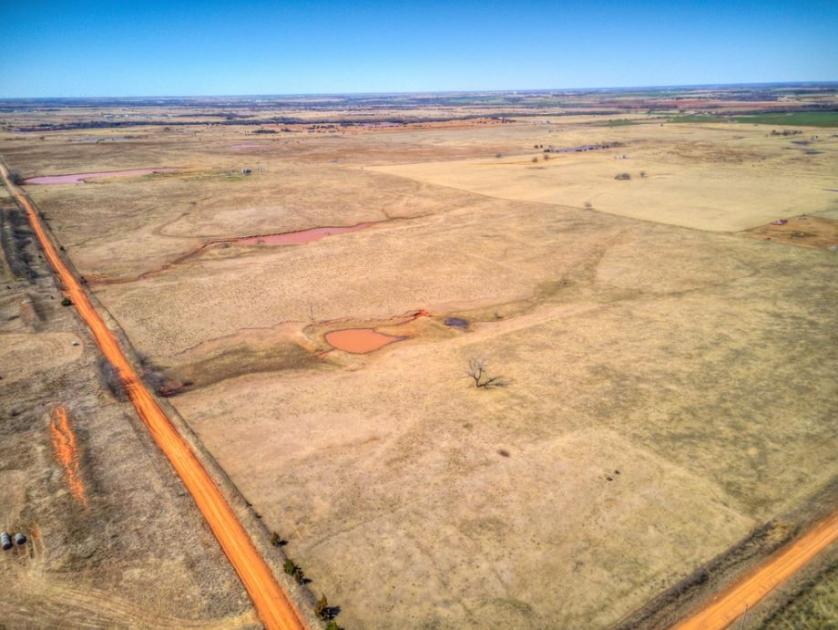
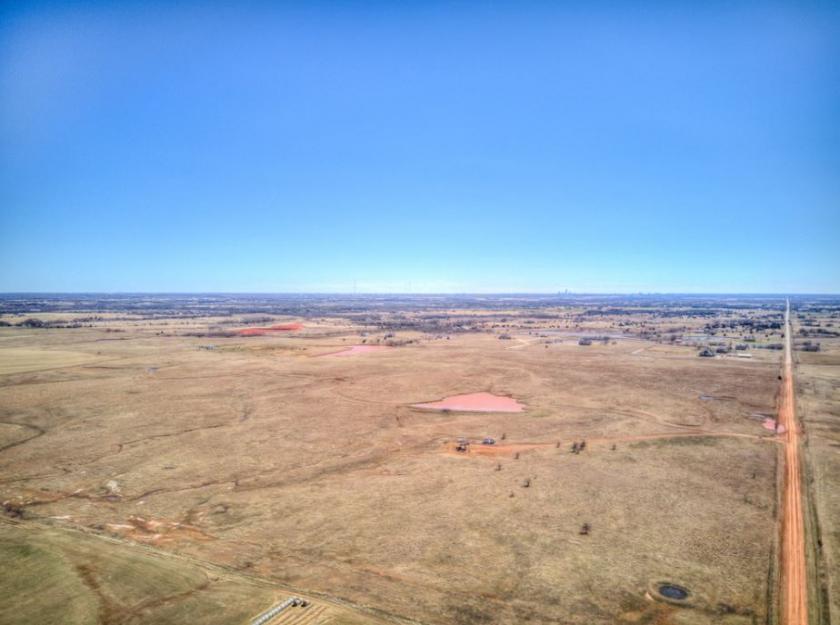
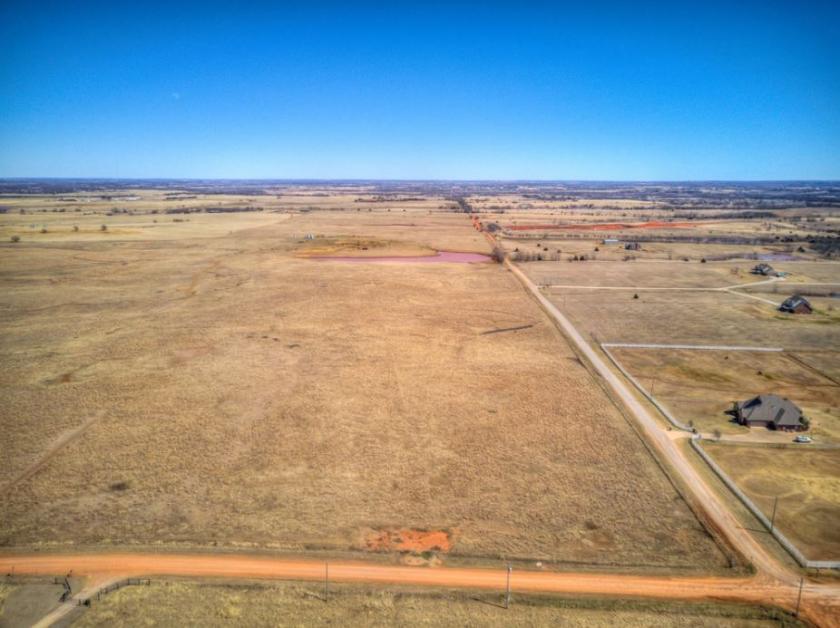
- • 240 Acres
- • Cashion Schools
- • Ready for development
- • Great location for residential homes
Additional Photos
Listing Agents

Brent Holliday
O: 405-948-7500
M: 405-788-1708
brenth@kwcommercial.com
O: 405-948-7500
M: 405-788-1708
brenth@kwcommercial.com
While we strive to provide the most accurate information, all listing information, and demographic data, is provided by third-parties. As such, MyEListing will not be responsible for the accuracy of the information. It is strongly recommended that you verify all information with the listing agent, and any relevant agencies, prior to making any decisions.


